
Figure 1. Transition precursors for the LE model, equation (4).
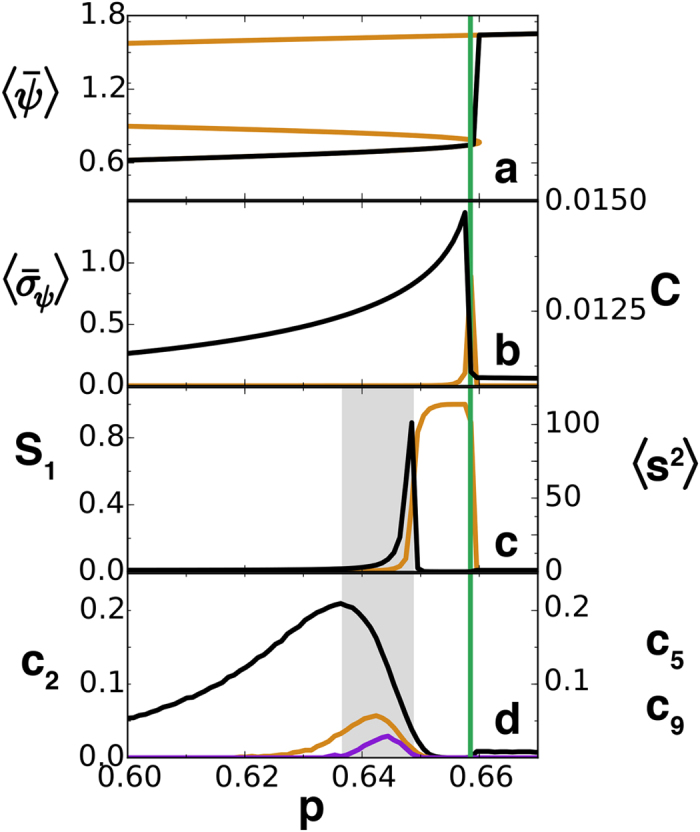
In (a) the steady homogeneous phosphorus concentration ψ (orange) and the numerically obtained spatial average (black, further averaged over R = 1000 temporal snapshots for each value of p) as a function of the control parameter p which is slowly increased from low to high values. In (b)  , the spatial standard deviation (black) of ψ used in refs 13, 14, 15 as a transition precursor is displayed averaged over R = 1000 temporal snapshots. In orange, the clustering of the functional network built with threshold γ = 0.21 also used as a precursor in refs 22,23. In (c) the relative size of the giant component, S1 (orange), and the average size of the leftover clusters (〈s2〉, black). (d) The probabilities c2 (black), c5 (orange), and c9 (purple) are shown. In all the panels, the vertical green line marks the position of the observed abrupt transition (Pd = 0.658). The grey area indicates the anticipation in parameter space gained over previous methods by using the peak of c2 as precursor of the percolation transition. All curves have been further averaged over 100 realizations of the random noise and initial conditions.