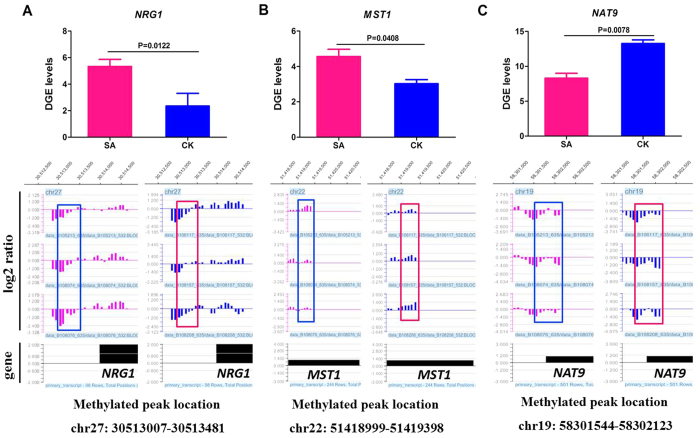
Figure 8. Transcriptional levels (upper panel) and methylated peaks (lower panel) of three differentially methylated and expressed genes.
(A) NRG1 gene (relatively hypomethylated and up-regulated in SA cows). (B) MST1 gene (relatively hypomethylated and up-regulated in SA cows). (C) NAT9 gene (relatively hypermethylated and down-regulated in SA cows). Red and blue boxes indicate the differentially methylated peaks in SA and CK cows, respectively. The log2 ratio represents the logarithm of the ratio of MeDIP DNA probe signal value and input DNA probe signal value for individuals, and it is normalised. Black solid box indicates the transcription region of a gene. P < 0.01 and P < 0.05 indicate highly significant difference and significant difference between the SA group and CK group, respectively.

