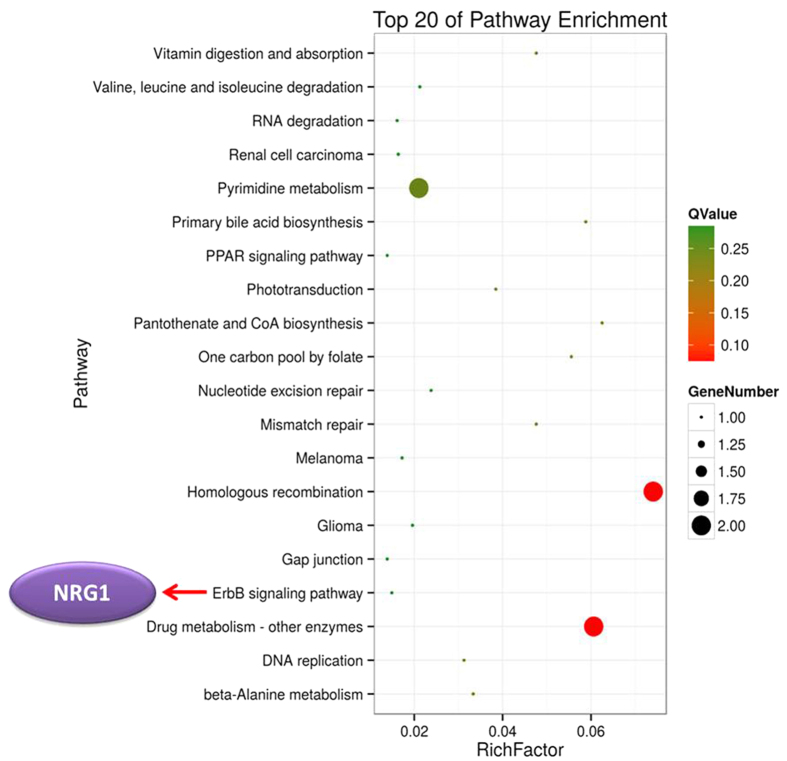
Figure 9. Scatter plot of the top 20 KEGG enrichments.
The X-axis represents the rich factor. The rich factor is the ratio of differentially methylated and expressed gene numbers annotated in this pathway term to all gene numbers annotated in this pathway term. The Y-axis is the pathway enrichment terms. Q-value represents the corrected P, and a small Q-value indicates high significance. The red arrow indicates the functional related gene within the pathway.

