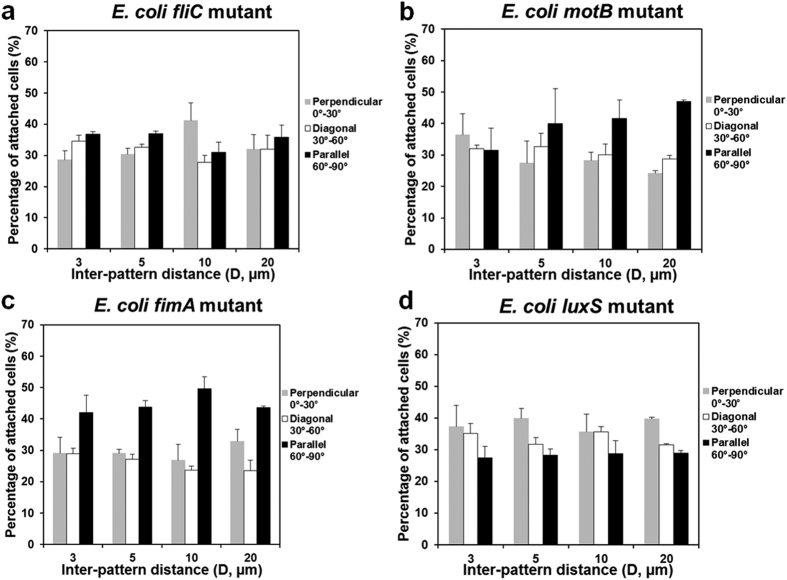
Figure 2. Orientation of isogenic mutant cells on top of 5 μm wide line patterns (mean ± standard error shown; at least three biological replicates were tested for each sample).
(a) fliC mutant (E. coli RHG01/pRSH103), (b) motB mutant (E. coli RP3087/pRSH103), (c) fimA mutant (E. coli RHG02/pRSH103), (d) luxS mutant (E. coli KX1485/pRSH103).

