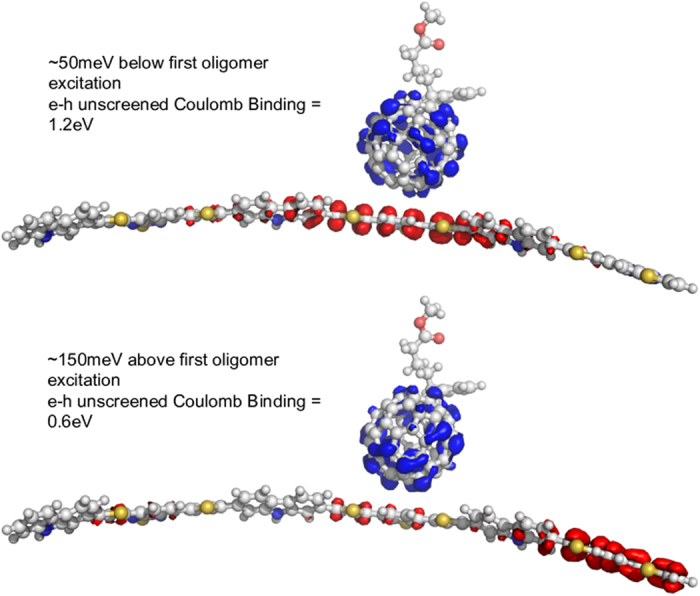
Figure 2. Redistribution of charge, excitation energy, and unscreened Coulomb binding energy for two excitations of a CDTBT oligomer: PCBM molecule pair.

Isosurfaces show change in charge distribution between ground state and excited states (electron density moves from red to blue regions). We stress that these are just exemplary structures showing one possible configuration of the pair, and that the states shown are only two out of the ensemble, selected to show the typical energy and nature (degree of CT) of excited state of the donor:acceptor complex. They are not exhaustive.
