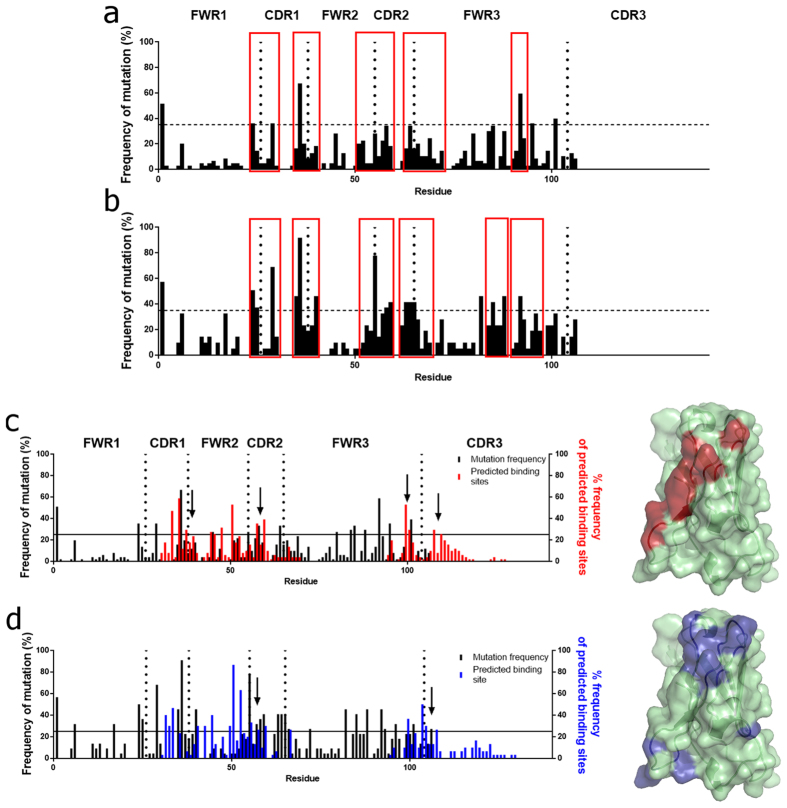
Figure 5. Somatic hypermutation frequency hotspots and predicted binding sites define distinct patterns in cutaneous melanomas and in normal skins.
Divergence from germline sequences from melanomas (a), (n = 51) and normal skins (b) (n = 29) (red boxes: mutational clusters) (horizontal lines ≥ 35% identify somatic hypermutation ‘hotspots’). ((c,d), Left) Frequency of occurrence of predicted binding residues (n = 51 melanomas, red (c)), (n = 29 normal skins, blue (d), clusters indicated by arrows), superimposed on somatic hypermutation frequencies (black). Sequences compared to IMGT for non-silent mutations resulting in amino acid change; FWR and CDR: vertical dotted lines; horizontal lines at ≥25% identify predicted binding sites. ((c,d), Right) Residues predicted to participate in antigen recognition in ≥25% of sequences (red, melanomas; blue, normal skins) on a homology model of a V region sequence.

