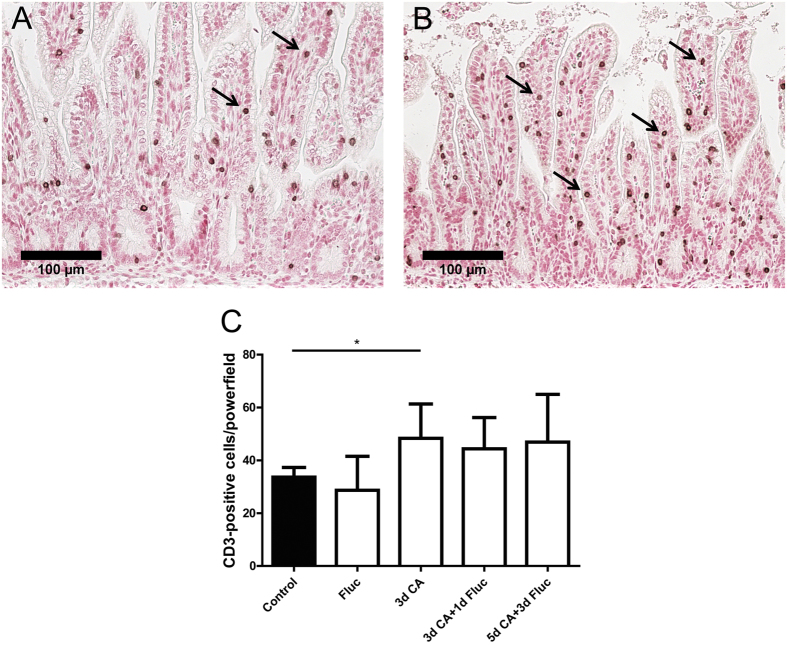
Figure 5. Number of CD3 + cells in the fetal ileum.
For each experimental group, intestinal sections of (A) control and animals that were exposed to C.albicans for 3 days (B) were stained by immunohistochemistry for CD3. For each experimental group, positive expressing cells of CD3 (arrow) were counted and the mean cell counts per high power field per animal is indicated (C). Data are presented as mean ± SD. *p < 0.05. CD, cluster of differentiation.

