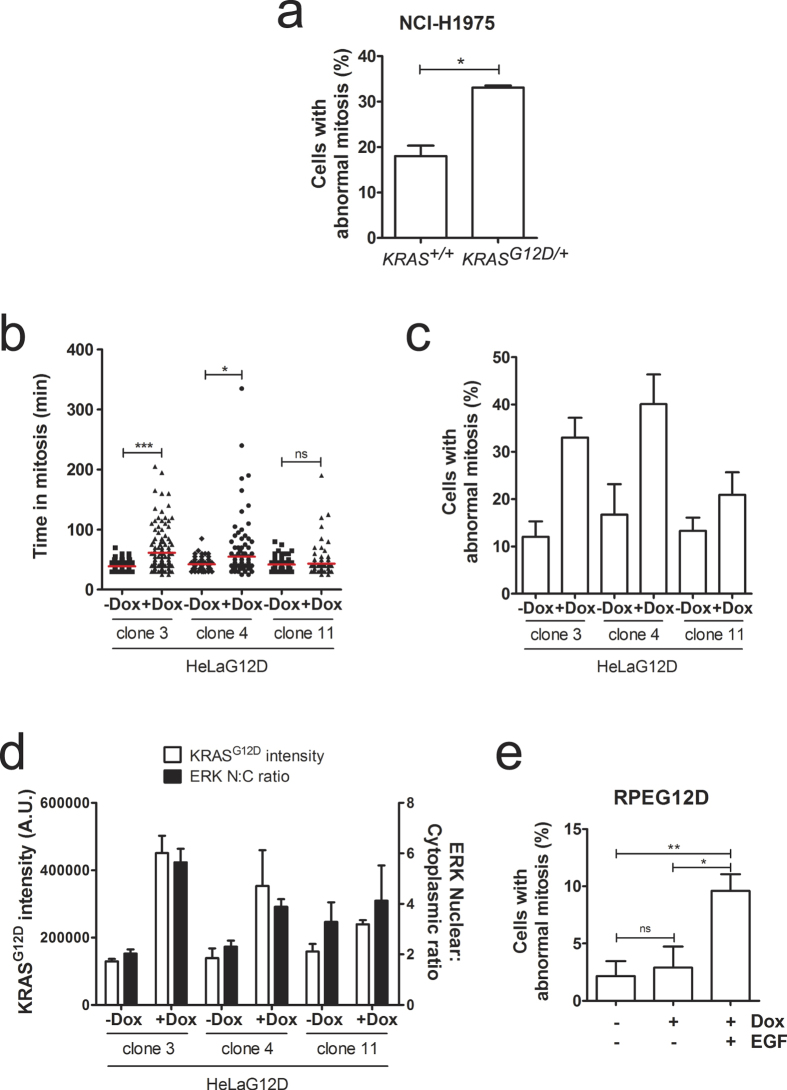
Figure 2. KRASG12D-induced mitotic defects are accompanied by increased nuclear accumulation of ERK1/2.
(a) Asynchronously growing GFP-H2B-expressing NCI-H1975 KRAS+/+ and KRASG12D/+ cells were monitored by time-lapse microscopy for 24 hours. Bar graph depicts the percentage of cells with abnormal division (mean ± S.E.M. from 3 independent experiments), with >40 cells analysed per experiment for each cell line. *p < 0.05 (paired t-test). (b) Individual HeLaG12D clones expressing GFP-H2B were treated with doxycycline for 24 hours then monitored by time-lapse microscopy for a further 24 hours. The scatter dot plot shows time spent in mitosis, represented in minutes. Data was obtained from 3 independent experiments, and 67–97 cells were analysed for each condition. Red lines represent mean values. ns, not significant; *p < 0.05; ***p < 0.0001 (Mann Whitney test). (c) Bar graph depicting the percentage of cells with abnormal division from the time-lapse movies in (b). Bars represent mean values ± S.E.M. from 3 independent experiments. (d) Individual HeLaG12D clones were treated with doxycycline for 24 hours, then fixed and stained for the myc tag (KRASG12D) and ERK1/2. Bar graph depicts KRASG12D pixel intensity (left Y axis) and nucleo-cytoplasmic (N:C) ratio of ERK1/2 (right Y axis). (e) GFP-H2B-expressing RPEG12D cells were treated with doxycycline and synchronised in G1/S by addition of thymidine, then released from the G1/S block in the presence or absence of EGF and monitored by time-lapse microscopy. Bar graph depicts the percentage of cells with abnormal division. Bars represent mean values ± S.E.M. from 3 independent experiments, with 16–64 cells analysed per condition in each experiment. ns, not significant; *p < 0.05; **p < 0.005 (paired t-test).

