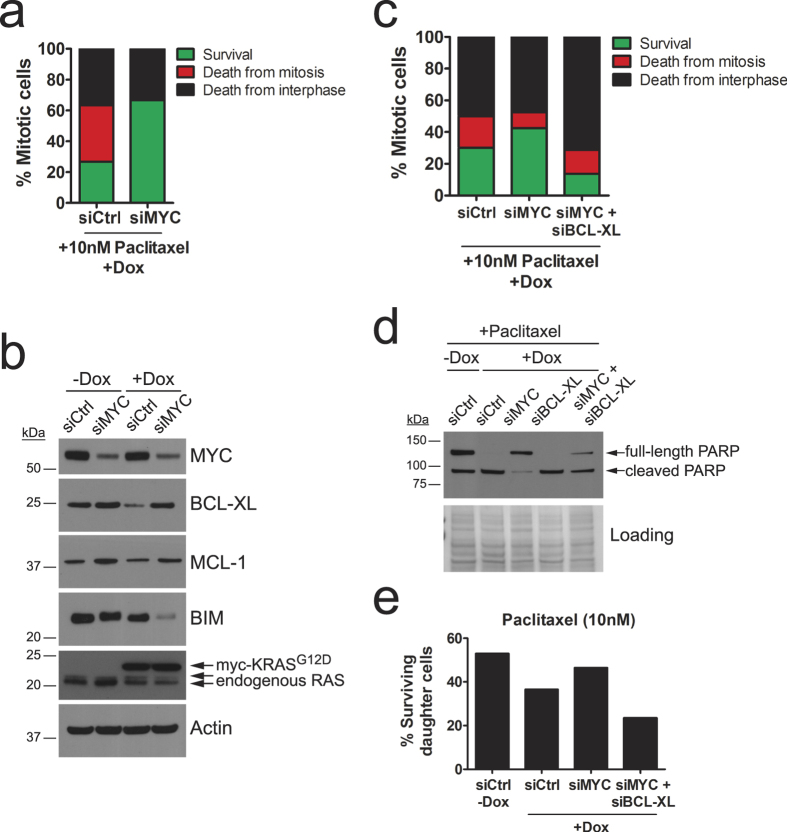
Figure 4. Cell death elicited by anti-mitotic agents in KRASG12D-expressing HeLa cells is mediated by MYC and BCL-XL.
(a) Stacked bar graph representing the fate of HeLaG12D cells pre-treated with doxycycline, transfected with MYC or control siRNA oligos, then challenged with 10 nM paclitaxel and monitored by phase-contrast time-lapse microscopy (n = 30 cells analysed per condition). Bar colors represent cell fates as described in Fig. 3c. (b) Immunoblot analysis of HeLaG12D cells untreated or treated with doxycycline for 48 hours, then transfected with control or MYC siRNA oligos and probed with the indicated antibodies. Actin was used as a loading control. (c) Stacked bar graph representing cell fate of HeLaG12D cells pre-treated with doxycycline, transfected with control, MYC and BCL-XL siRNA oligos, then challenged with 10 nM paclitaxel and monitored by phase-contrast time-lapse microscopy (n = 80 cells analysed per condition in two independent experiments). Bar colors represent cell fates as described in Fig. 3c. (d) Immunoblots of HeLaG12D cells pre-treated with doxycycline, transfected with control, MYC and/or BCL-XL siRNA oligos, then challenged with 100 nM paclitaxel for 28 hours. PARP cleavage was monitored as a sign of apoptotic cell death. Equal amounts of protein lysates were loaded for each sample, and Ponceau staining was used as a loading control, as Actin levels decreased in samples with significant levels of death. (e) HeLaG12D cells were pre-treated with doxycycline, transfected with control, MYC and BCL-XL siRNA oligos, then challenged with 10 nM paclitaxel and monitored by phase-contrast time-lapse microscopy. Bar graph depicts the percentage of daughter cells surviving the 48-hour filming period.

