Figure 2.

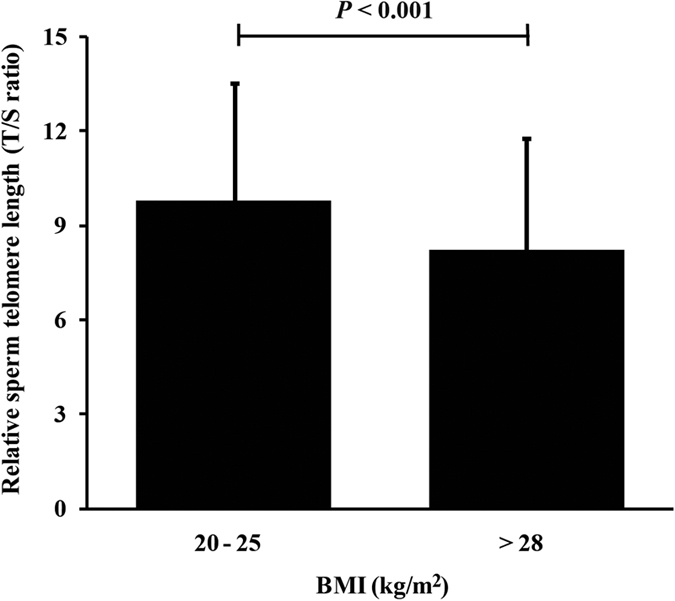
Comparison of relative STL (T/S ratio) in men with normal BMIs (20–25 kg/m2; N = 345) and overweight BMIs (>28 kg/m2; N = 306) (Student’s t test; bars represent standard deviations).

Comparison of relative STL (T/S ratio) in men with normal BMIs (20–25 kg/m2; N = 345) and overweight BMIs (>28 kg/m2; N = 306) (Student’s t test; bars represent standard deviations).