
Figure 2.
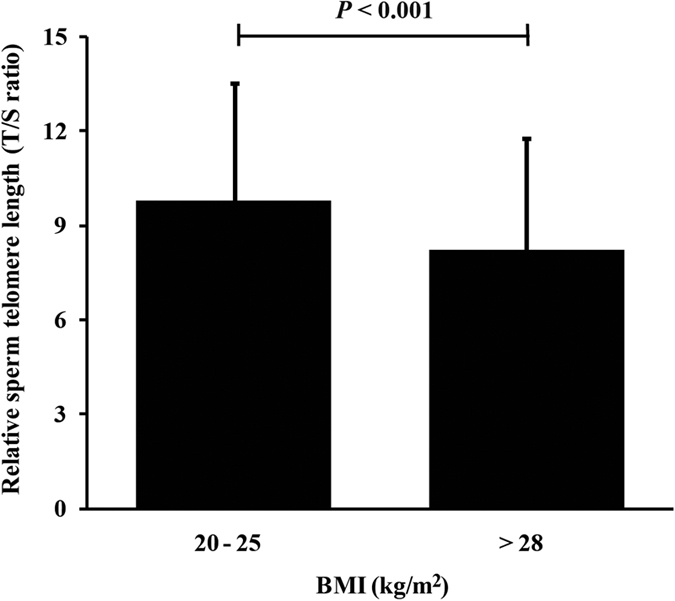
Comparison of relative STL (T/S ratio) in men with normal BMIs (20–25 kg/m2; N = 345) and overweight BMIs (>28 kg/m2; N = 306) (Student’s t test; bars represent standard deviations).
Official websites use .gov
A
.gov website belongs to an official
government organization in the United States.
Secure .gov websites use HTTPS
A lock (
) or https:// means you've safely
connected to the .gov website. Share sensitive
information only on official, secure websites.
Comparison of relative STL (T/S ratio) in men with normal BMIs (20–25 kg/m2; N = 345) and overweight BMIs (>28 kg/m2; N = 306) (Student’s t test; bars represent standard deviations).