
FIG 2.
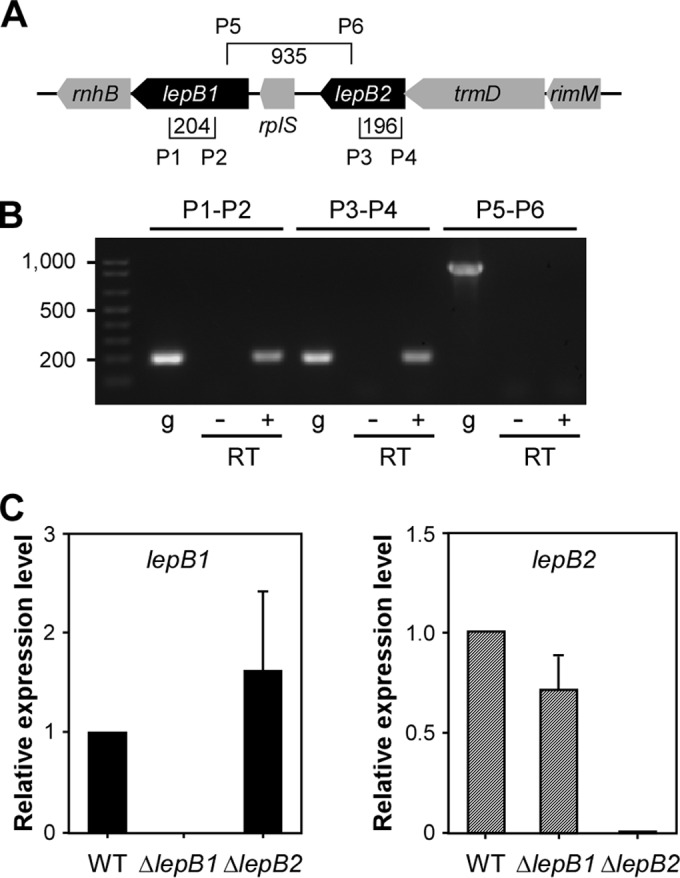
lepB1 and lepB2 are independently expressed. (A) Specific primers (P) were designed to detect lepB1, lepB2, and a region encompassing both. Brackets show primer positions, and values specify the sizes of amplicons in base pairs. (B) With the specific primers shown in panel A, reverse transcription-PCR was performed to determine if lepB1 and lepB2 are independently expressed. A plus or minus sign indicates that reverse transcription-PCRs were performed in the presence or absence of RT. PCRs with gDNA (g) were used as a control. (C) Quantitative real-time PCR used to determine the expression levels of lepB1 and lepB2 relative to those in parental strain MG1 by the 2−ΔΔCT method, where 16S rRNA served as the internal control. The data presented are averages of three independent experiments performed in triplicate; error bars represent standard deviations.