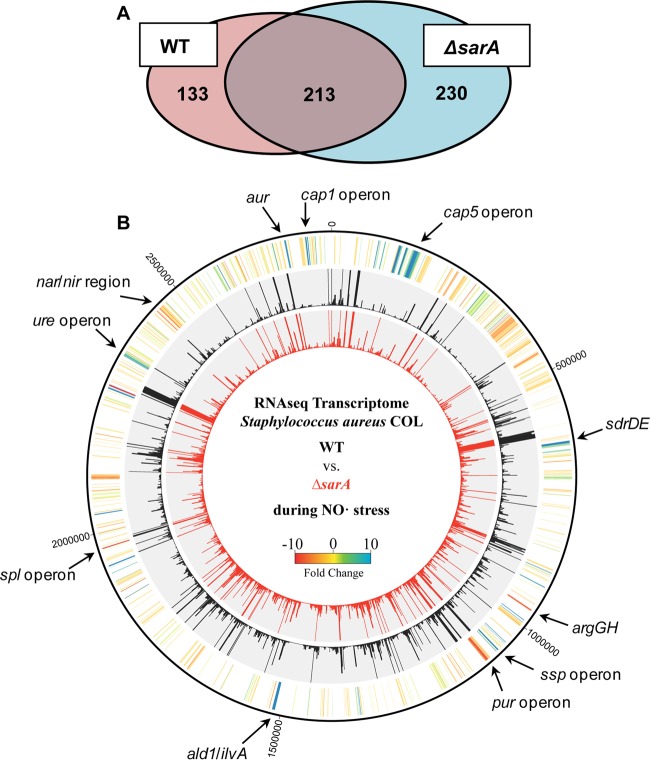
FIG 5.
The ΔsarA mutant exhibits global gene dysregulation following NO˙ exposure. RNA-Seq was performed on S. aureus COL WT and ΔsarA mutant strains grown in PNG and exposed to 4 mM DETA-NO for 1 h at an OD660 of 0.4. (A) Venn diagram of genes induced by NO˙ in the WT and the ΔsarA mutant. Genes induced in the WT were designated by a >2-fold increase in expression in NO˙-exposed WT cells compared to aerobically grown WT cells. NO˙-exposed WT expression levels were compared to NO˙-exposed ΔsarA mutant expression levels, and genes with >2-fold-lower expression in the ΔsarA mutant were said to be induced in the WT only. Genes with >2-fold-greater expression in NO˙-exposed ΔsarA mutant cells compared to NO˙-exposed WT cells are said to be induced in the ΔsarA mutant only. (B) Genomic map showing transcription profiles of NO˙-exposed WT and ΔsarA mutant strains. The middle (black) circle depicts RPKM values for NO˙-exposed WT cells, and the inner (red) circle depicts RPKM values for the NO˙-exposed ΔsarA mutant. The outer (yellow) circle is a heat map showing fold changes in expression between the WT and the ΔsarA mutant.

