FIG 2.
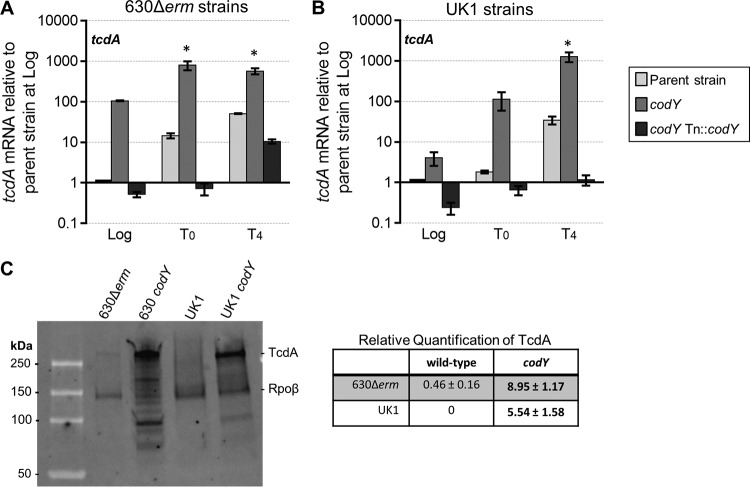
Transcript and protein levels of tcdA are increased in codY mutants. (A and B) qRT-PCR analysis of tcdA in the 630Δerm, MC364 (630 codY), and MC442 (630 codY Tn916::codY) strains (A) and in the UK1, LB-CD16 (UK1 codY), and MC443 (UK1 codY Tn916::codY) strains (B) grown in 70:30 liquid sporulation medium. Samples for RNA were collected during logarithmic growth (Log; OD600, ∼0.5), during the transition to stationary phase (time zero [T0]), and at 4 h after the transition into stationary phase (T4). The means and standard errors of the means (SEM) of results from four biological replicates are shown. Two-way repeated-measures ANOVA, followed by Dunnett's multiple-comparison test, was used to compare parent strains with the corresponding codY mutants or the parent strain with the respective complemented strain at the designated time points. *, P ≤ 0.05. (C) A representative TcdA and Rpoβ Western blot of strains grown to stationary phase in 70:30 liquid sporulation medium. The means and SEM of relative fluorescence units (RFUs) from four biological replicates are shown. Two-tailed Student's t test was used to compare the parent strain with the codY mutant. Bold text indicates significance (P ≤ 0.05).

