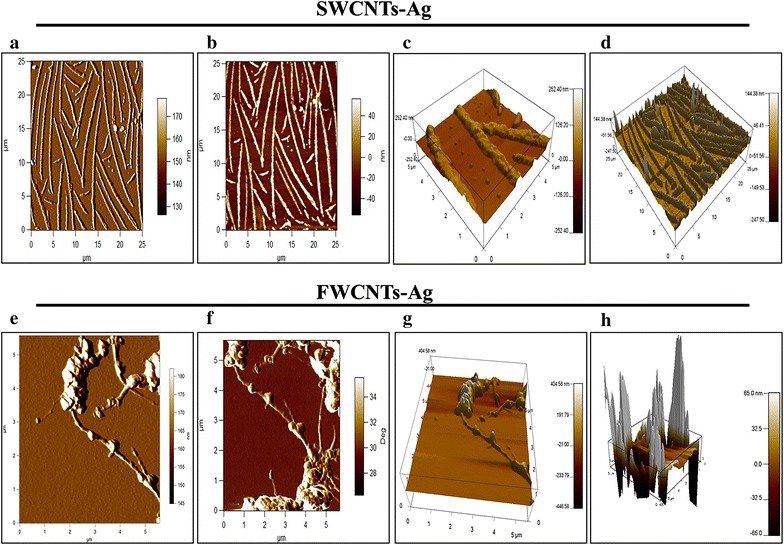
Fig. 5.

Atomic force microscopy (AFM). Structural characterization of FSWCNTs-Ag and SWCNTs-Ag was carried out to further validate the conjugation of TP359 to SWCNTs-Ag in FSWCNTs-Ag. a–d AFM analysis of plain SWCNTs-Ag. e–h AFM analysis of FSWCNTs-Ag. SWCNTs-Ag in two (a, b) and three (c, d) dimensional views. FSWCNTs-Ag are presented as two (e, f) and three (g, h) dimensional images. The cantilever oscillation frequency was tuned to the resonance frequency of approximately 256 kHz. The set point voltage was adjusted for optimum image quality. Both height and phase information were recorded at a scan rate of 0.7 Hz, and in 512 × 512 pixel format
