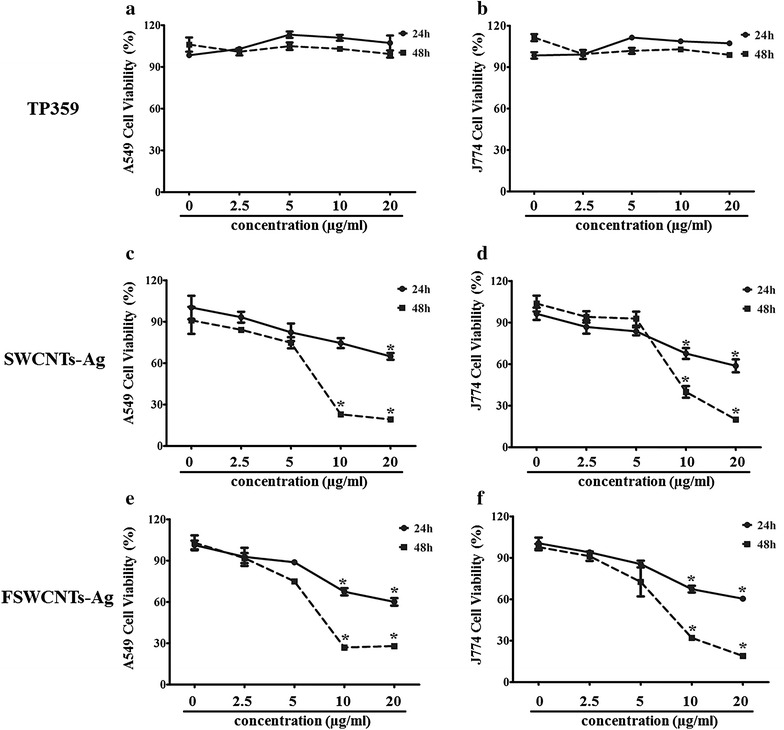
Fig. 7.

In vitro cytotoxicity assay for TP359, SWCNTs-Ag and FSWCNTs-Ag. a Cytotoxicity of A549 cells exposed to TP359. b Toxicity to J774 cells exposed to various concentrations of TP359. c A549 cell viability exposed to SWCNTs-Ag. d Cell viability of J774 treated with SWCNTs-Ag. e A549 cells viability treated with FSWCNTsAg. f Toxicity of J774 cells exposed to FSWCNTs-Ag. All cells were treated with the peptide and nanocomposites for 24 and 48 h and statistical differences were calculated compared to controls. All values were expressed as fold change expressed compared to non-treated bacteria. * when p ≤ 0.05 indicate significant differences; ** when p ≤ 0.01 indicate highly significant differences. Error bars represent standard deviations of the results determined with at least three biological replicates
