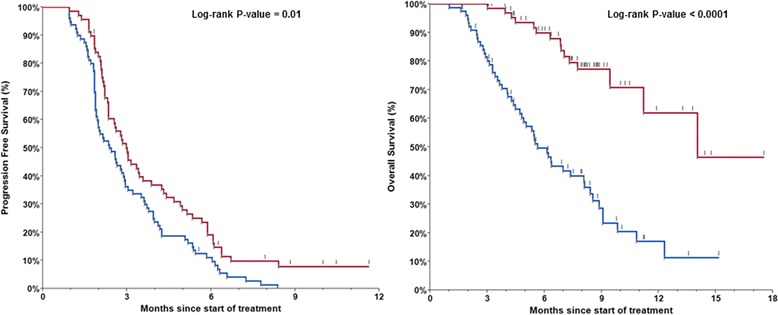
Fig. 2.

Kaplan-Meier curves for progression-free survival (PFS; median 3.0 months versus 2.4 months; Log-rank P-value = 0.01) as well as overall survival (OS; median 14.0 months versus 5.6 months; Log-rank P-value < 0.0001) for patients who achieved chemotherapy induced neutropenia (CIN) ≥ grade 2 CTCAE (red line – 69 patients (46.3 %) – CIN-1-month positive) as compared to those who did NOT have ≥ grade 2 CIN at the 1-month mark (blue line – 80 patients (53.7 %) – CIN-1-month negative) after starting treatment with TAS-102
