
Fig. 1.
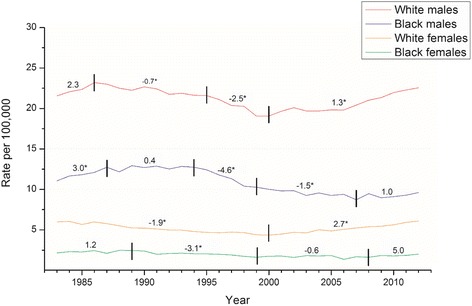
Trends in the age-standardized mortality rate (U.S. 2000 standard population) of suicide in the four populations in the U.S. Vertical lines indicate year in which a joinpoint analysis identifies a change in suicide trends. Annual percentage change in suicide rates are marked in each segment, those with asterisk (*) means significantly different from zero at α = 0.05