
Fig. 3.
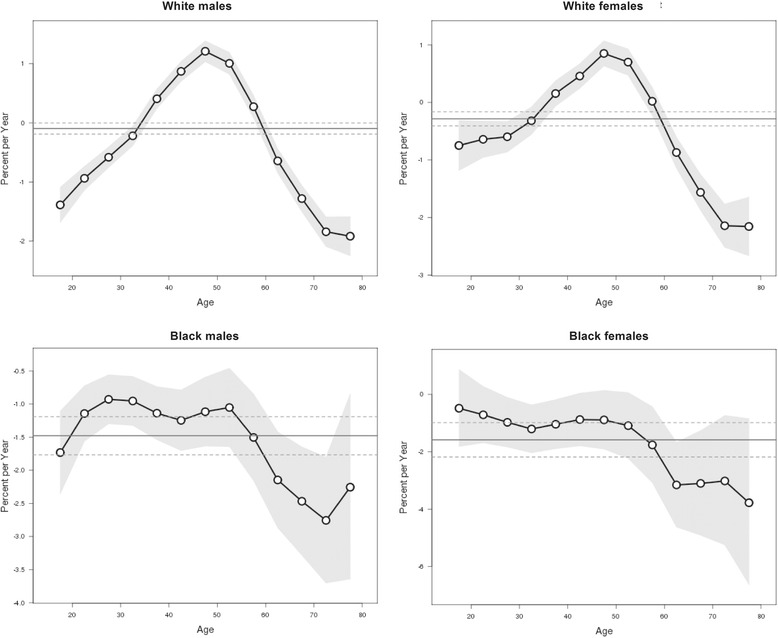
Local drift values of suicide rates. Age group specific annual percent change (%) in the suicide mortality rates and the corresponding 95 % confidence intervals by gender and race in the U.S
Official websites use .gov
A
.gov website belongs to an official
government organization in the United States.
Secure .gov websites use HTTPS
A lock (
) or https:// means you've safely
connected to the .gov website. Share sensitive
information only on official, secure websites.
Local drift values of suicide rates. Age group specific annual percent change (%) in the suicide mortality rates and the corresponding 95 % confidence intervals by gender and race in the U.S