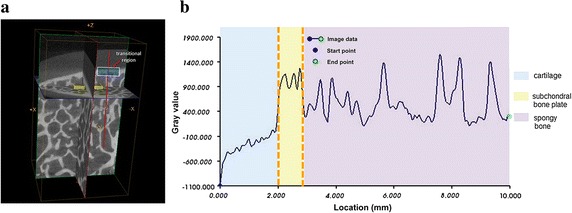
Fig. 2.

Changes of gray value along the line from cartilage to spongy bone in the three-dimensional model generated by micro-computed tomography. a Scanning picture of sample excised from the middle of the medial condyle position (Fig. 1) of cadaveric right knee. The yellow boxes are examples of volume of interests; the white box is example of transitional region; the red line indicates the direction of gray value detection. b Gray value variation along the line from cartilage to spongy bone. The red line in (a) corresponds to the yellow area in (b). The distance from the surface of cartilage to the subchondral plate below was about 2.3 mm
