
FIG 7.
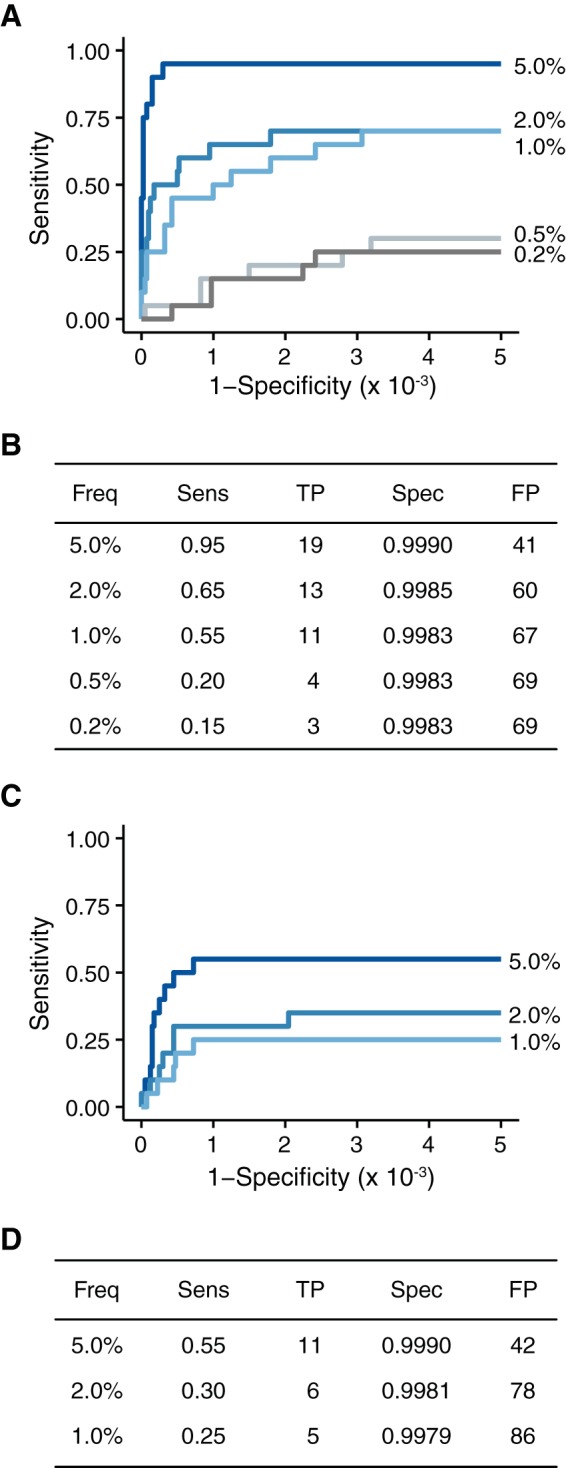
Accuracy of DeepSNV on populations with lower input nucleic acid levels. (A) ROC curve for the samples with 104 genomes/μl. (B) Summary of the data in panel A at a P value threshold of 0.01. (C) ROC curve for the samples with 103 genomes/μl. (D) Summary of the data in panel C at a P value threshold of 0.01.