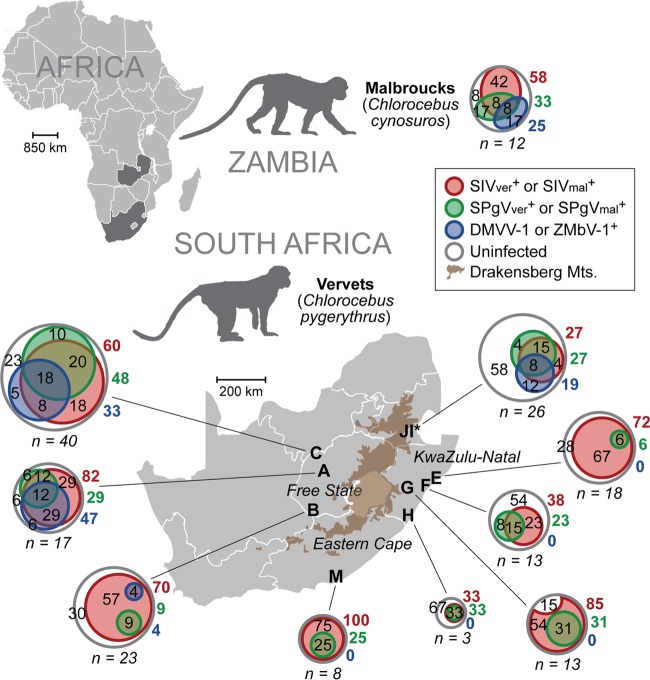
FIG 2.
Geographic distribution and prevalence of AGM plasma viruses. Shown are prevalences of SIV, SPgV, and simian arteriviruses in wild AGMs sampled from Zambia (malbrouck monkey [Chlorocebus cynosuros]) and South Africa (vervet monkey [Chlorocebus pygerythrus]). Venn diagrams of each monkey population show the percentages of uninfected, monoinfected, coinfected, and triple-infected monkeys for each of these three viruses. Gray circles represent the total numbers of monkeys sampled and are proportional to the sample size from each location. Numbers within the gray circles but outside the colored circles are the percentages of each population that are triple negative for virus (white). Colored circles within gray circles show the percentages of each population infected with SIV, SPgV, or DMVV-1/ZMbV-1 that are monoinfected, coinfected, or triple infected. Adjacent colored numbers outside the circles show the percentages of each population infected with the respective virus. Sites I and J are from the Riverside Rehabilitation Center, which houses vervet monkeys from across the region. The prevalence of each virus was determined by using a combination of deep sequencing, qRT-PCR, and RT-PCR.

