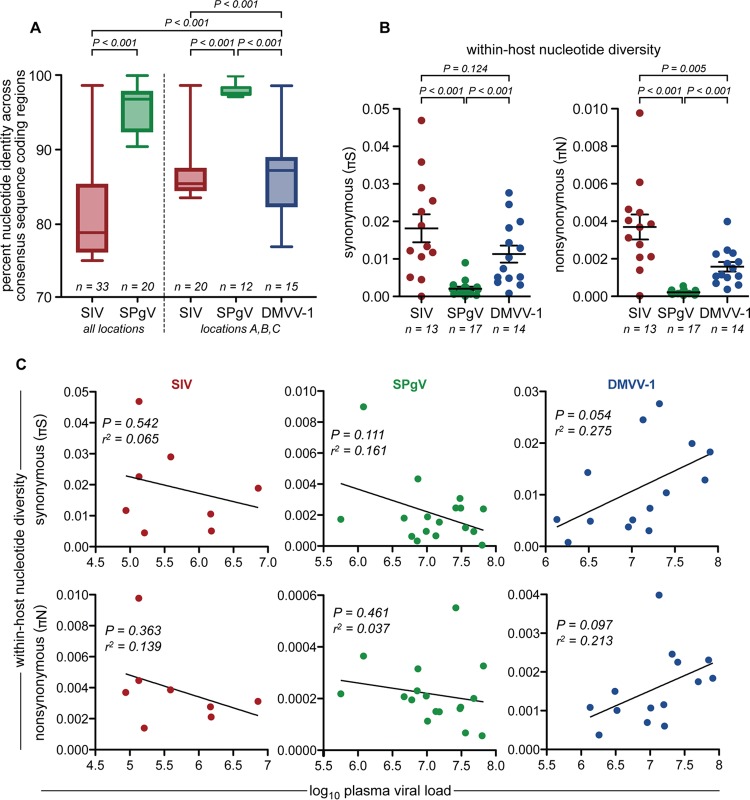
FIG 6.
Genetic diversity of AGM plasma viruses. (A) Complete consensus sequences spanning the entire coding region of each virus were aligned, and a pairwise comparison between each aligned sequence was performed. Percent identity values from each comparison were plotted and compared by using a two-tailed unpaired t test. Boxes show the middle two quartiles, and whiskers show the minimum and maximum percent identities observed. (B) Synonymous (πS) and nonsynonymous (πN) viral nucleotide diversities within each infected monkey, determined by calculating πS and πN values across the entire viral genome. Only samples that yielded virus sequences with >100× coverage for >99% of the protein-coding region of the genome were used for this analysis. Significance was assessed by using a two-tailed unpaired t test, with error bars showing the standard errors of the means. (C) Linear regression correlating within-host nucleotide diversity and plasma viral load for each virus.

