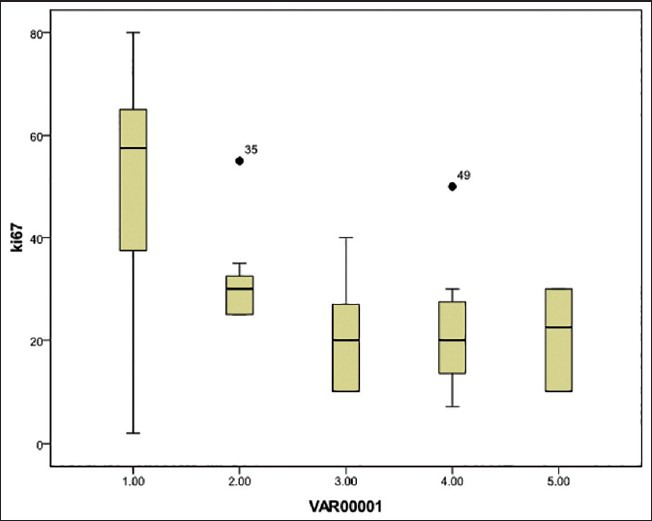
Figure 3.

Box plot showing expression of Ki-67 over the spectrum of lesions representing endometrial carcinogenesis. Ki-67 expression in percent is shown on the y-axis. Various groups are plotted on the x-axis. 1= Endometrial carcinoma group [median 57.5; interquartile range 38.75-62.5]; 2 = Atypical hyperplasia group [median 30; interquartile range 25-32.5] • 35 = Extreme outlier case no. 2 of Table 15; 3= Complex hyperplasia group [median 20; interquartile range 10-27] 4= Simple hyperplasia group [median 20; interquartile range 13.5-27.5, • 49= Extreme outlier case no. 9 of Table 17]; and 5 = Proliferative endometrium group [median 22. 5; interquartile range 11.25-30]
