Figure 4.
H3 Dynamics during the Developmentally Controlled Endocycle.
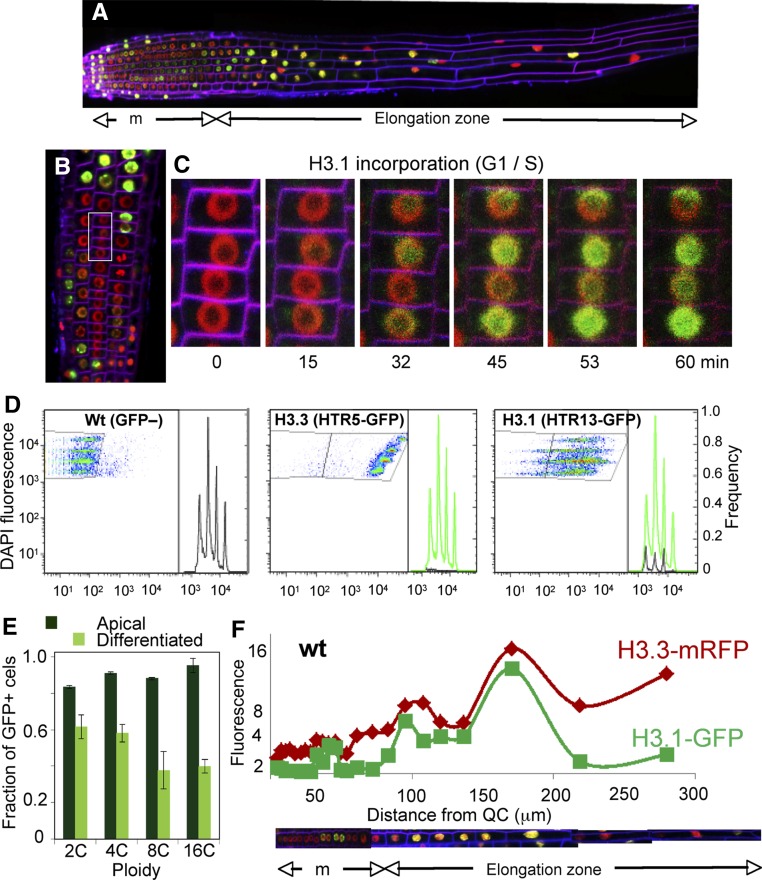
(A) Composite image of a root expressing H3.1(HTR3)-GFP and H3.3(HTR5)-mRFP to visualize the labeling pattern along the root developmental zones. Cell membranes stained with FM4-64 appear in magenta.
(B) Detail of the epidermal layer at the meristem/elongation boundary. Inset: nuclei followed in the live-imaging experiments summarized in (C).
(C) Time-lapse confocal microscopy series at the indicated times of nuclei highlighted in (B) to show the onset of the first endocycle as revealed by H3.1(HTR3)-GFP incorporation. See full experiment in Supplemental Movie 1.
(D) Analysis of ploidy level of wild-type (GFP–), H3.3(HTR5)-GFP, and H3.1(HTR13)-GFP nuclei of the 5-mm apical part of the root by two-channel flow cytometry. DAPI was used for nuclear staining and determination of DNA content (2C to 16C). Wild-type Col-0 and H3.3(HTR5)-GFP nuclei were used to define the GFP– (left panel) and GFP+ (middle panel) gates.
(E) Fraction of H3.1(HTR13)-GFP-positive nuclei in the 5-mm apical (dark green) and differentiated (light green) parts of the root. Data are mean values ± sd (n = 3).
(F) The H3.1/H3.3 balance along the root developmental zones. The relative fluorescence intensity of H3.1(HTR3)-GFP and H3.3(HTR5)-RFP of each nucleus in an entire cell file was plotted against its position in the RAM (µm). The cell file is reconstructed at the bottom, indicating the meristem (m) and the elongation and differentiation zones. The relative amount of H3.3 intensity was used to estimate the ploidy level (y axis). A representative example of an epidermal cell file expressing H3.1(HTR3)-GFP and H3.3(HTR5)-RFP in wild-type Col-0 is shown.

