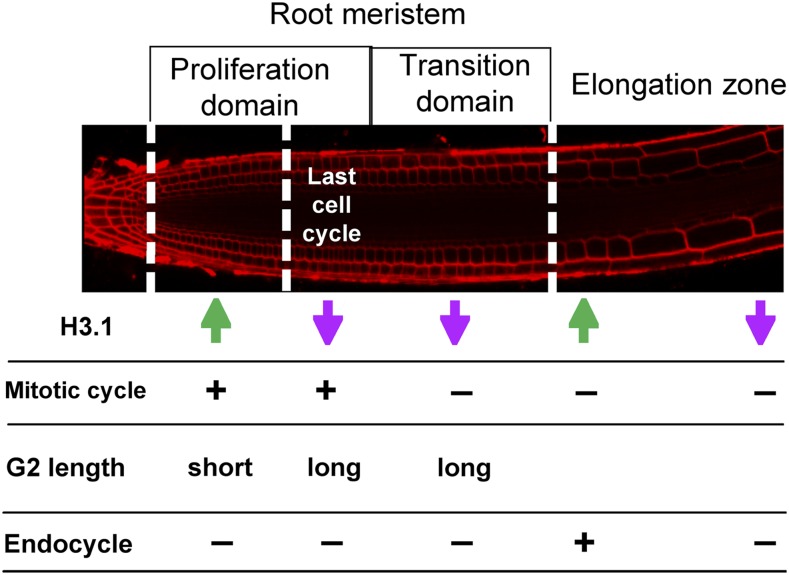
Figure 7.
Cell Proliferation Dynamics in the RAM.
Schematic representation of the root cell populations according to their anatomical positions. The H3.1/H3.3 ratio is indicated with arrows (green, high H3.1; magenta, low H3.1). Other characteristics, such as the G2 length and the mitotic and endocycling potential, are also indicated.

