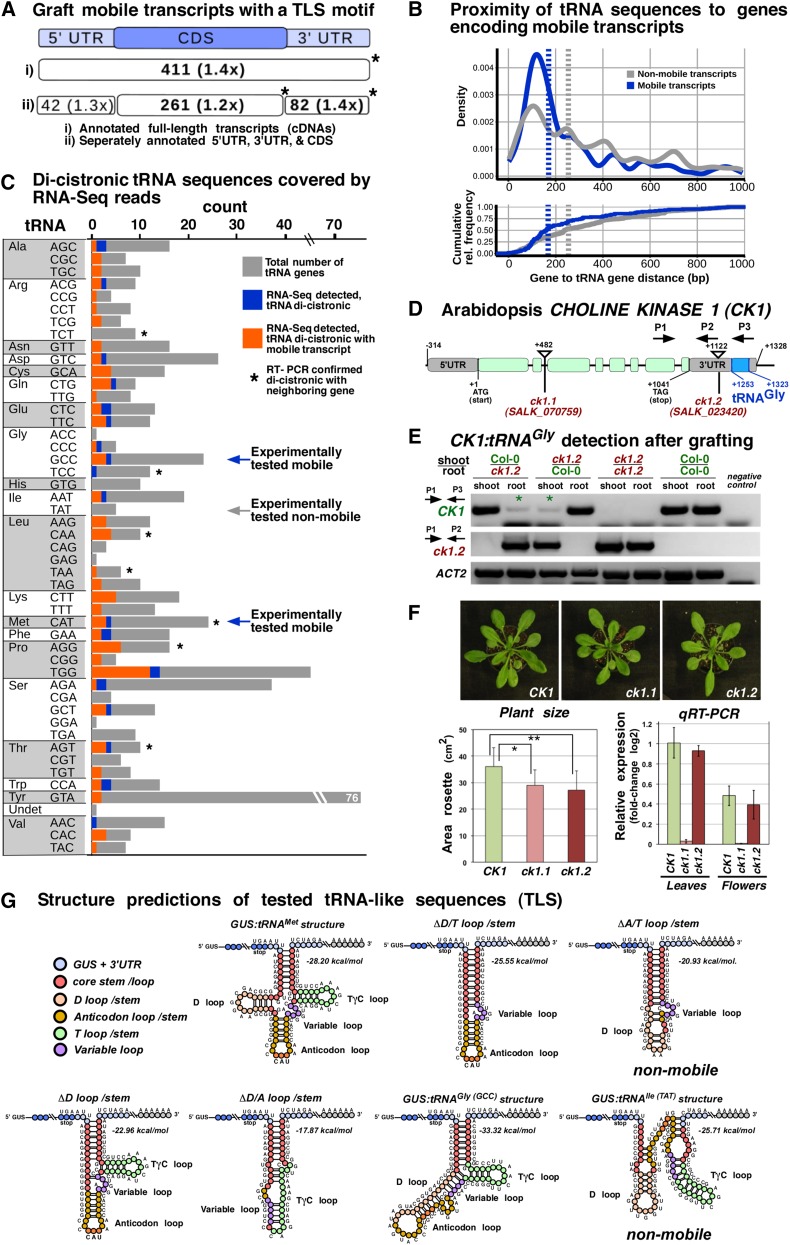
Figure 4.
Mobile Arabidopsis mRNAs and Occurrence of tRNA-Like Motifs.
(A) Number of all identified mobile transcripts (n = 3606) with predicted tRNA-like structures found by the default RNAMotif tRNA descriptor, which does not capture the tRNAIle (TAT) (Supplemental Figure 4). Absolute counts and enrichment in relation to transcripts not found in the mobile database are shown. Asterisks indicate significant counts (P < 0.05) according to Fisher’s exact test.
(B) Normalized frequency (estimated density) and cumulative relative frequency (ecdf) of inter-gene distances of tRNA-mRNA tandem gene pairs with the tRNA being located within 1000 nucleotides up- or downstream of genes coding for mobile transcripts (blue) or nonmobile predicted transcripts (gray). Vertical dashed lines indicate medians of shown distributions. Mobile transcript encoding loci in comparison to loci not producing mobile transcript show a significantly closer proximity to tRNA genes (two-sample, two-sided Kolmogorov-Smirnov test, P < 0.0003; Cohen's D d = 0.313).
(C) Number of tRNA genes according to their anticodon, which were detected as poly(A)-RNA:tRNA dicistronic transcripts in RNA-seq data. Orange, distribution of the 94 tRNA genes observed dicistronically; blue, tRNA genes (n = 24) associated with mobile transcripts; gray, TAIR10-annotated tRNA genes; asterisks, tRNA genes with dicistronic transcripts confirmed by RT-PCR; arrows, experimentally tested tRNA fusions.
(D) Schematic diagram of Arabidopsis CK1 gene (AT1G71697) and analyzed insertion mutants. CK1 mRNA exists as a dicistronic poly(A)-tRNA transcript. The ck1.2 mutant harbors a T-DNA insertion between the CK1 stop codon and the annotated tRNAGly (AT1G71700) in the 3′ UTR, resulting in a truncated poly(A) transcript lacking the tRNAGly sequences. RT-PCR primers are indicated as follows: P1 binding to exon 7 of CK1 CDS and P3 binding to tRNAGly sequences were used for wild-type CK1:tRNAGly identification. P1 together with P2, which is stretching the T-DNA left border, and CK1 3′ UTR were used for specific ck1.2 detection.
(E) RT-PCR with the indicated primers revealed that the CK1 poly(A) transcript is present in ck1.2 mutant samples (asterisks) originating from stem-grafted wild-type Col-0 tissue. In the reciprocal wild-type samples, a mutant CK1 poly(A) transcript produced in ck1.2 and lacking the 3′ UTR tRNAGly sequence was not detected.
(F) Phenotype of ck1.1 and ck1.2 and reverse transcription quantitative PCR of transcripts. Wild-type and ck1.2 plants show similarly high levels of CK1 transcript, whereas ck1.1 mutants show very low levels. Rosette area size measurements on adult plants revealed that both ck1.1 and ck1.2 mutants are significantly smaller than the wild type (Student’s t test, mutant versus wild type; P value ck1.1 = 0.006; P value ck1.2 = 0.002; n = 16 plants/line). Error bars indicate sd.
(G) Schematic folding structure of the GUS TLS 3′UTR motifs predicted according to their minimal free energy.

