Figure 6.
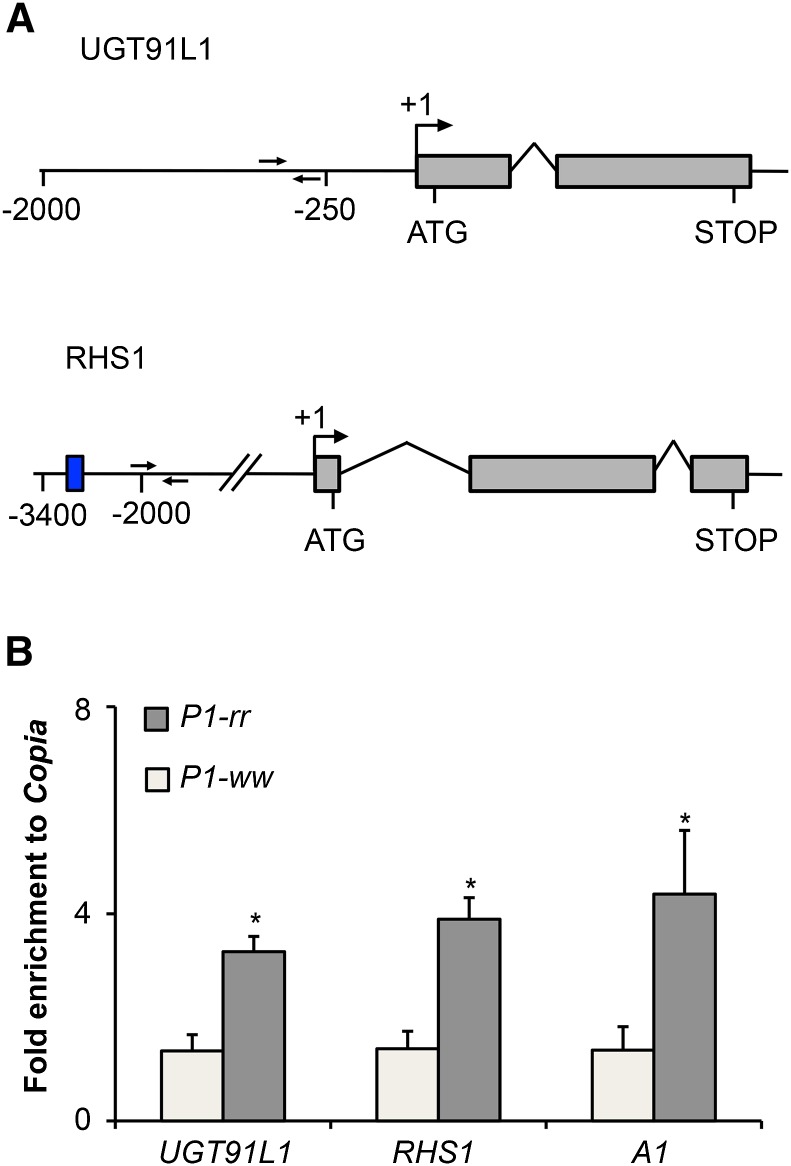
UGT91L1 and RHS1 Are Direct Targets of P1.
(A) UGT91L1 and RHS1 gene models. Exons are represented as gray boxes, introns as arched lines, and genomic regions as straight lines. Transcriptional start sites are depicted by perpendicular arrows at the +1 position; start (ATG) and stop (STOP) codon positions are also shown. MACS peaks estimated locations are indicated as a blue box. ChIP-qPCR primer locations are shown as head to head black arrows. Positions are given in base pairs from +1 transcriptional start sites.
(B) The bar plot corresponds to results from ChIP-qPCR experiments showing fold enrichment to Copia in P1-rr and P1-ww pericarps at 14 d after pollination for UGT91L1 and RHS1, using A1 as a positive control. Error bars correspond to se of the mean, using six biological replicates (n = 6). Asterisks denote statistically significant differences between P1-rr and P1-ww at P < 0.05 (two-tailed t test).

