Figure 7.
Functional Analysis of NAC020 in VISUAL.
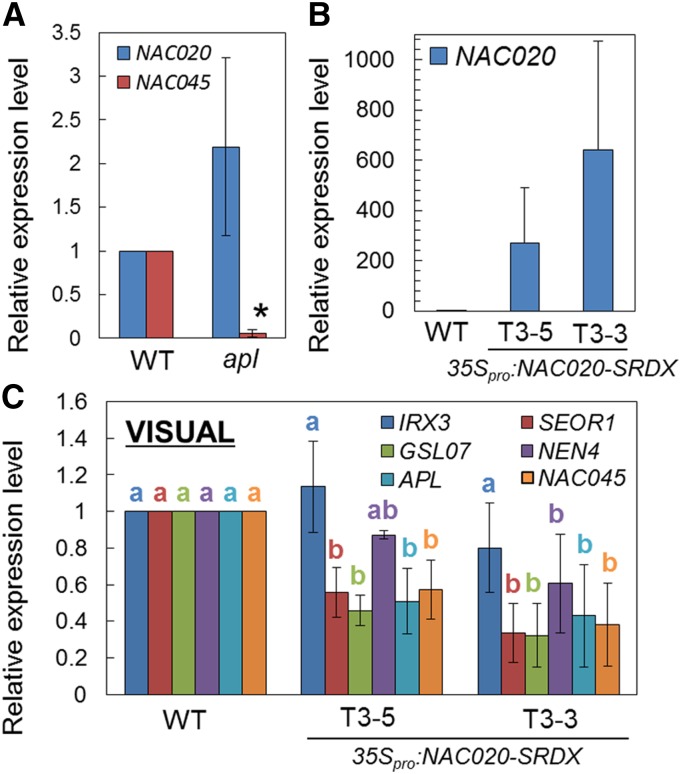
(A) Expression of NAC020 and NAC045 at 72 h after induction in VISUAL with the wild type and apl. Relative expression levels were calculated by comparison with the wild type. Error bars indicate sd (n = 3; biological replicates). Significant differences were examined by Student’s t test (*P < 0.05).
(B) Expression levels of NAC020 in 7-d-old seedlings of the wild type and two different 35Spro:NAC020-SRDX lines.
(C) Expression levels of xylem- (IRX3) and phloem-related genes (SEOR1, GSL07, NEN4, APL, and NAC045) in 35Spro:NAC020-SRDX lines at 72 h after induction. Relative expression levels were calculated by comparison with the wild type. Error bars indicate sd (n = 3; biological replicates). Significant differences (P < 0.05) are indicated by different letters (Tukey’s test).

