Figure 1.
The ckl2 Mutant Shows Impaired Stomatal Closure.
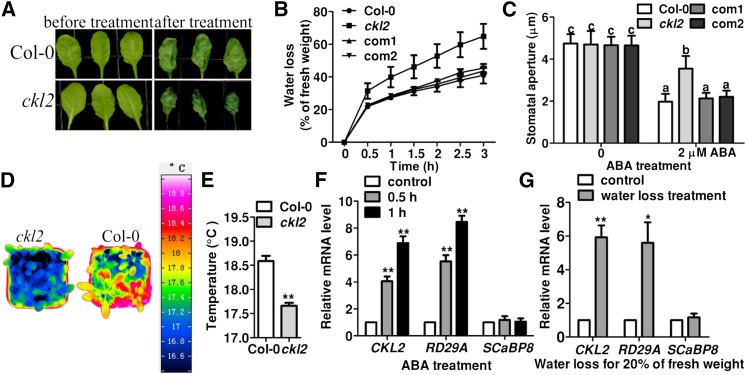
(A) Leaves detached from wild-type and ckl2 plants for 0 (left) and 3 h (right) of water loss treatment.
(B) Cumulative leaf transpirational water loss in Col-0, ckl2, and two rescued lines (com1 and com2) at the indicated times after detachment (means ± sd, n = 3).
(C) Stomatal bioassays for ABA-induced closure in Col-0, ckl2, and two rescued lines (com1 and com2). The data represent the means ± sd of three independent experiments; 50 stomata were analyzed per line. The data sets were tested as normal distribution by the Shapiro-Wilk test. Statistical significance was determined by Student’s t test; significant differences are indicated by different lowercase letters. The t test analysis of the data indicates the levels of significance to be P = 0.0034, 0.9986, and 0.9347 for ckl2 and the two rescued lines, respectively, compared with Col-0 after ABA treatment. Before ABA treatment, the levels of significance were P = 0.8075, 0.2705, and 0.6197 for ckl2 and the two rescued lines, respectively, compared with Col-0.
(D) Representative pseudocolored infrared images of leaf temperature of Col-0 and ckl2 mutant plants.
(E) Leaf (surface) temperature of Col-0 and ckl2 mutant plants measured from images obtained by infrared thermography, as in (D), and analyzed by InfraTec reporter software. Twenty leaves were analyzed per line. Data are means ± sd (n = 3). The data sets were tested for normal distribution by Shapiro-Wilk test. Statistical significance (**P < 0.01) was determined by Student’s t test.
(F) and (G) Real-time PCR analysis revealed the induced expression of CKL2 by ABA treatment or water loss treatment. Seven-day-old seedlings were treated with 20 μM ABA for 0.5 or 1 h (F) or were treated for water loss until leaves had lost 20% of their fresh weight (G). RD29A and SCaBP8 were used as controls. Expression levels of CKL2, RD29A, and SCaBP8 without ABA/water loss treatment were set as 1.0, respectively. The experiments were repeated three times. Data are means ± sd. Statistical significance (**P < 0.01 and *P < 0.05) was determined by Student’s t test. t test analysis of the data shown in (F) indicates the level of significance to be P = 0.0042 and 0.0023 for the data of CKL2 relative mRNA level at 0.5 and 1 h after ABA treatment, respectively, compared with the control. The positive control RD29A also had a higher relative mRNA level when treated with ABA for 0.5 h (P = 0.0033) and 1 h (P = 0.0012) compared with the control. The negative control SCaBP8 showed no obvious difference when treated with ABA for 0.5 h (P = 0.6890) and 1 h (0.7891) compared with the control. As shown in (G), CKL2 was induced by water loss treatment (P = 0.0066). The positive control RD29A also had a higher relative mRNA level when treated with water loss until seedlings lost 20% of their fresh weight (P = 0.0225). As a negative control, the relative mRNA level of SCaBP8 was not significantly different when treated with water loss until seedlings lost 20% of their fresh weight (P = 0.5851) compared with the control.

