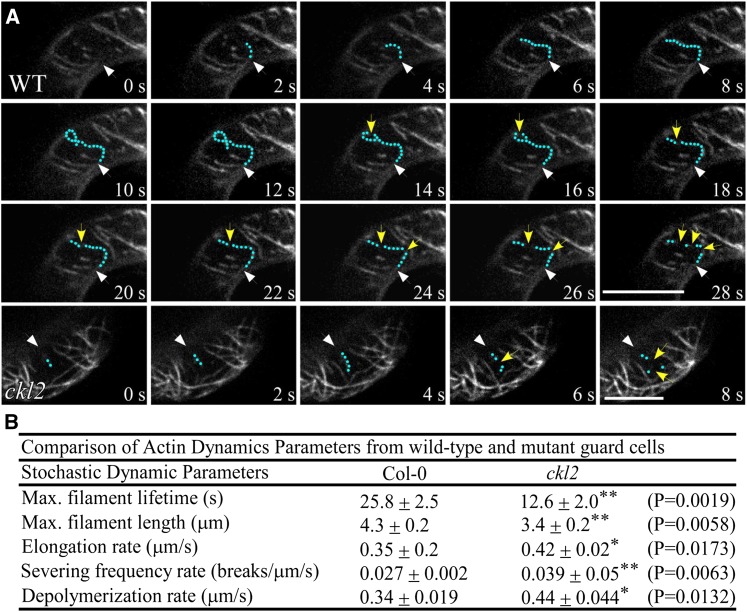
Figure 4.
The ckl2 Mutant Shows Different Actin Dynamics from the Wild Type.
(A) Time-lapse images of single actin filaments in guard cells of Col-0 and ckl2 35Sp:GFP-fABD2-GFP transgenic plants. Green dots highlight a representative single actin filament. Yellow arrows indicate actin filament-severing events. White arrows indicate the position at which growth of the single actin filament began. Bars = 5 μm.
(B) Actin filament dynamic parameters in Col-0 and ckl2. The parameters associated with single actin filament dynamics in Col-0 and ckl2 guard cells were quantified from spinning disk confocal micrographs. Values represent means ± sd, n = 30. The data sets were tested for normal distribution by the Shapiro-Wilk test. Statistical significance was determined by Student’s t test. Quantification of *P < 0.05 and **P < 0.01.

