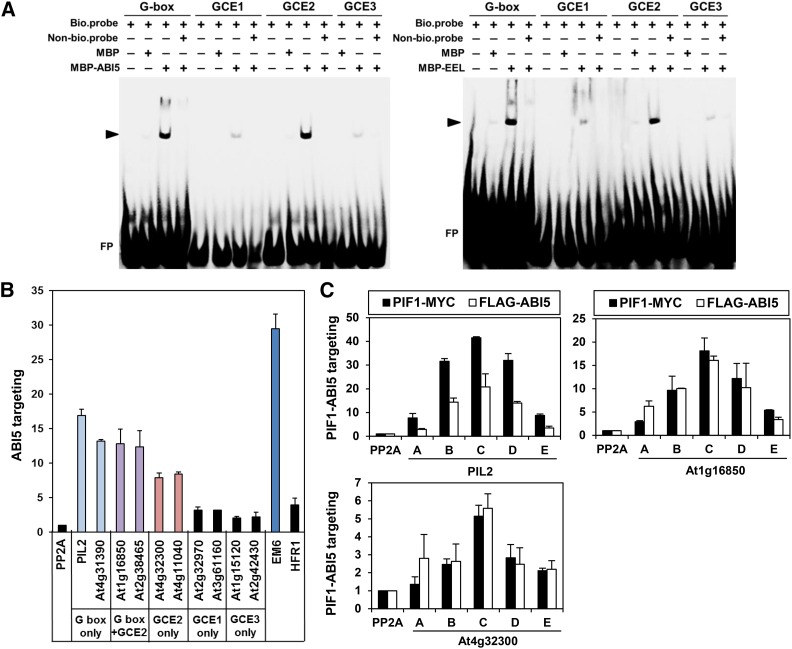
Figure 4.
ABI5 Targets a Subset of PBSs Possessing GCE2s.
(A) EMSA demonstrating the binding of group A bZIPs (ABI5 and EEL) to a G-box and a GCE2. MBP-tagged ABI5 and EEL proteins and biotinylated double-stranded oligomers (bio.probe) were used for this assay. Nonbiotinylated double-stranded oligomers (Non-bio.probe) were used at 100× the concentration of the biotinylated double-stranded oligomers. The triangles indicate the shifted bands (ABI5, left panel; EEL, right panel). FP indicates free, unbound DNA probes. The sources for each probe sequence are as follows: G-box, the PIL2 promoter; GCE1, the At3g18080 promoter; GCE2, the At1g16850 promoter; GCE3, the At1g17830 promoter.
(B) ABI5-mediated enrichment in imbibed phyBoff seeds of PBSs possessing a G-box, a GCE2, or a G-box and a GCE2. Gene names on the x axis indicate amplified promoter fragments covering either PIF1 binding peaks, an ABI5 binding site (Em6), or nonbinding control sites within the body of the PP2A gene (Supplemental Figure 5). Stable transgenic plant seeds expressing FLAG-tagged ABI5 and anti-FLAG antibody were used for this ChIP assay. Error bars indicate sd (n = 2 biological replicates).
(C) ABI5 and PIF1 show similar enrichment profiles at three selected PBSs in imbibed phyBoff seeds. The letters on the x axis indicate ChIP-PCR amplicons in each promoter shown in Supplemental Figure 5. Stable transgenic plant seeds expressing either MYC-tagged PIF1 (PIF1-MYC) or FLAG-tagged ABI5 (FLAG-ABI5) and anti-MYC or FLAG antibodies were used for this ChIP assay. Error bars indicate sd (n = 2 biological replicates).

