Figure 6.
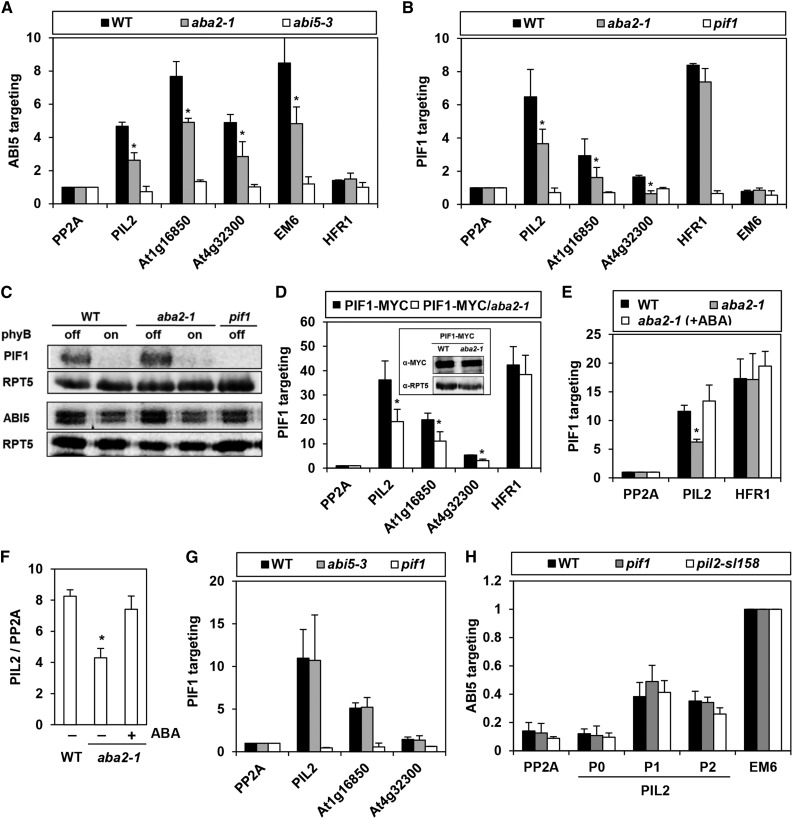
PIF1 Targeting to a Subset of PBSs Is Compromised in the aba2 Mutant.
(A) Reduced enrichment of promoter fragments by ABI5 in the aba2 mutant. This ChIP assay used an anti-ABI5 antibody in imbibed phyBoff seeds. Gene names on the x axis indicate the amplified promoter fragments that cover either PIF1 binding peaks (PIL2, At1g16850, and At4g32300), the ABI5 binding site (Em6), or a nonbinding site (PP2A and HFR1). Asterisks indicate statistical differences (P < 0.05, Student’s t test). Error bars indicate sd (n = 2 biological replicates).
(B) Reduced enrichment of ABI5-targeting PBSs (PIL2, At1g16850, and At4g32300) by PIF1 in the aba2 mutant. This ChIP assay used an anti-PIF1 antibody in imbibed phyBoff seeds. PP2A and Em6 were used as nonbinding controls of PIF1. Asterisks indicate statistical differences (P < 0.05, Student’s t test). Error bars indicate sd (n = 2 biological replicates).
(C) Immunoblot analysis using anti-PIF1 and anti-ABI5 antibodies shows that the wild type, aba2, and pif1 mutant imbibed phyBoff and phyBon seeds have similar levels of PIF1 and ABI5 proteins.
(D) Reduced enrichment of ABI5-targeting PBSs (PIL2, At1g16850, and At4g32300) by PIF1-MYC in the aba2 mutant. This ChIP assay used an anti-MYC antibody in imbibed phyBoff seeds. Stable transgenic plant seeds expressing MYC-tagged PIF1 (PIF1-MYC) were used. The inset shows that the wild-type and aba2 mutant backgrounds both produce similar levels of 35S-driven PIF1-MYC. Asterisks indicate statistical differences (P < 0.05, Student’s t test). Error bars indicate sd (n = 2 biological replicates).
(E) A ChIP assay showing exogenous ABA treatment (10 μM) rescues the reduced PIF1 binding to the PIL2 promoter in the aba2 mutant. This ChIP assay used an anti-PIF1 antibody on imbibed phyBoff seeds. For the ABA treatment, aba2 seeds were imbibed in media containing 10 μM ABA. The asterisk indicates a statistical difference (P < 0.05, Student’s t test). Error bars indicate sd (n = 2 biological replicates).
(F) PIL2 transcript levels in wild-type and aba2 mutant seeds in either the presence or absence of exogenous ABA (10 μM). The asterisk indicates a statistical difference (P < 0.05, Student’s t test). Error bars indicate sd (n = 2 biological replicates).
(G) Similar targeting of PIF1 to PBSs (PIL2, At1g16850, and At4g32300) in both wild-type and abi5-3 mutant seeds. This ChIP assay used an anti-PIF1 antibody on imbibed phyBoff seeds. Error bars indicate sd (n = 2 biological replicates).
(H) Similar enrichment of PIL2 promoter by ABI5 in both pif1 and pil2-sl158 mutant seeds. This ChIP assay used an anti-ABI5 antibody in imbibed phyBoff seeds. P0, P1, P2, Em6, and PP2A indicate ChIP amplicons shown in Figure 3A. Error bars indicate sd (n = 3 biological replicates).

