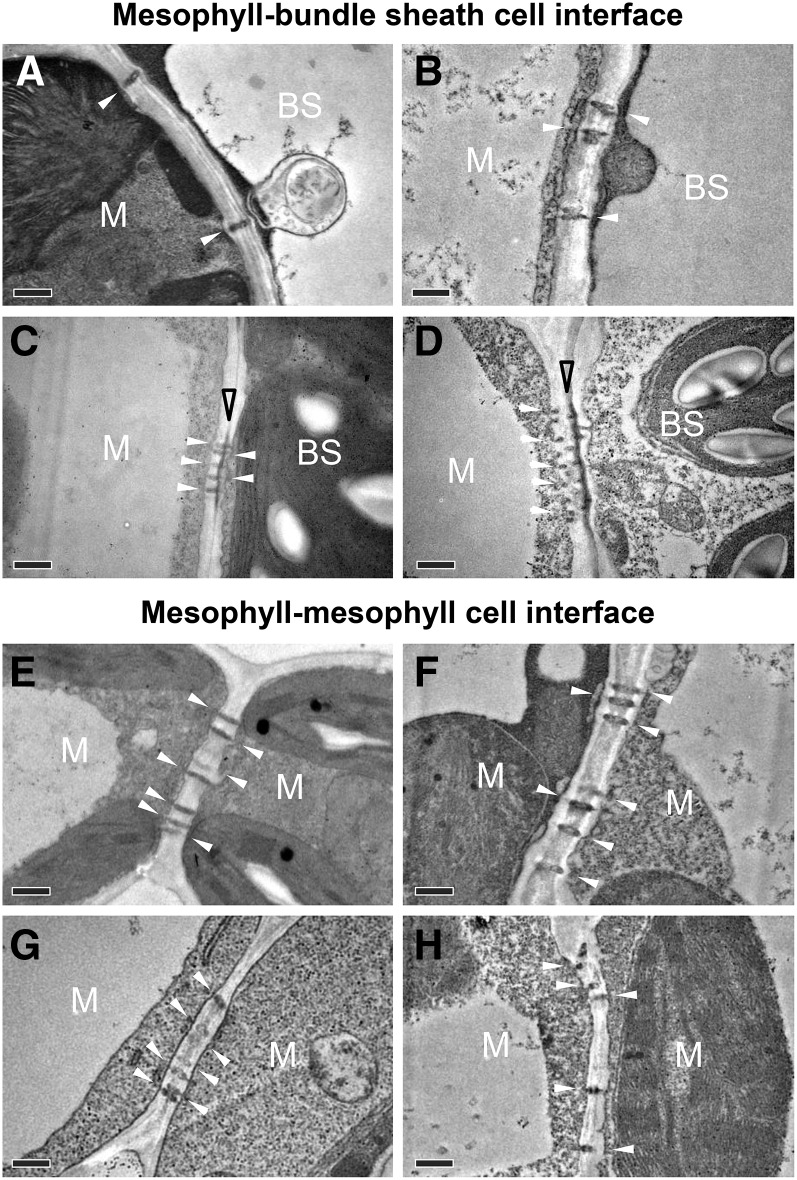
Figure 2.
Transmission Electron Micrographs of Plasmodesmata at Cell Interfaces in Leaves of C3 and C4 Species.
(A) and (E) Rice, C3.
(B) and (F) Wheat, C3.
(C) and (G) S. viridis, C4.
(D) and (H) Maize, C4.
White and open black arrowheads indicate plasmodesmata and suberin lamella, respectively. Bars = 0.5 µm.

