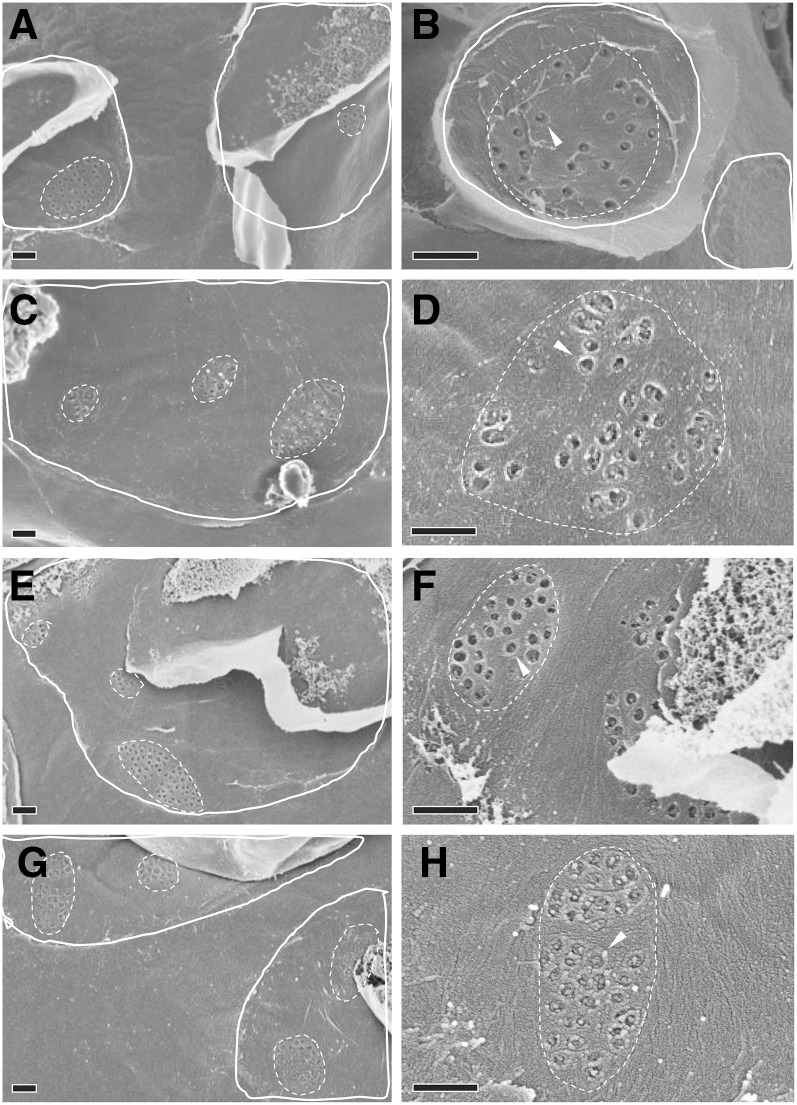
Figure 4.
Field Emission Scanning Electron Micrographs of Plasmodesmata at the M-BS Cell Interface of C3 and C4 Species.
(A) and (B) Rice, C3.
(C) and (D) Wheat, C3.
(E) and (F) S. viridis, C4.
(G) and (H) Maize, C4.
(A), (C), (E), and (G) Example enlargements from M-BS attachment sites (solid white outlines) free of overlying mesophyll cell debris, containing pitfields (dotted white outlines). The underlying bundle sheath cell surface outside the attachment sites would normally face an intercellular space within the leaf. The clear areas within the attachment sites indicate M-BS cell wall connections that lack plasmodesmata.
(B), (D), (F), and (H) Individual pitfields (dotted outlines) within M-BS attachment sites, showing pitfield plasmodesmata (arrowheads). Bars = 0.5 µm.

