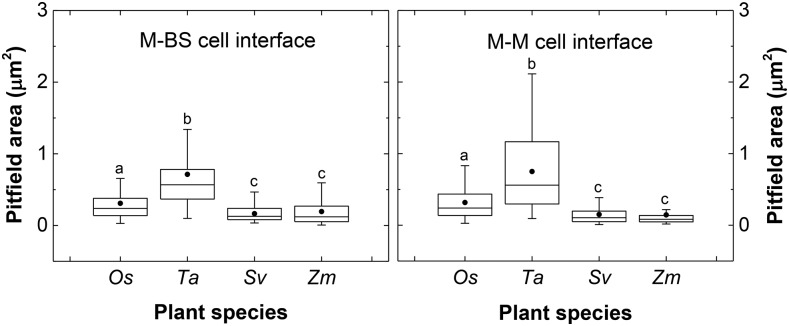
Figure 5.
Pitfield Area at Cell Interfaces of Leaves of C3 and C4 Species Derived from Field Emission Scanning Electron Micrograph Measurements.
The box and whisker represent the 25 to 75 percentile and minimum-maximum distributions of the data, respectively. Closed circles give the overall means. Statistical differences according to MATLAB two-sample t test at P value < 0.05 are indicated by letters. Values indicated by the same letter are not statistically different. Os, Oryza sativa; Ta, Triticum aestivum; Sv, Setaria viridis; Zm, Zea mays.

