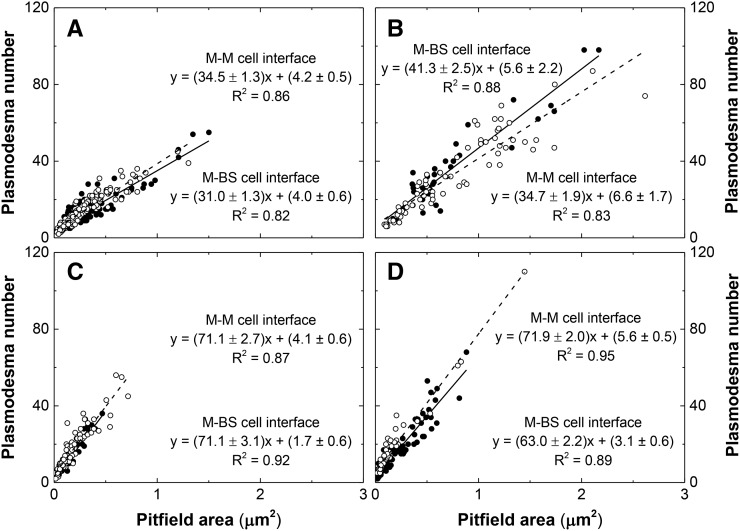
Figure 6.
Plasmodesmata Frequency per Pitfield Area at Cell Interfaces in Leaves of C3 and C4 Species.
(A) Rice, C3.
(B) Wheat, C3.
(C) S. viridis, C4.
(D) Maize, C4.
Closed circles correspond to the values obtained from the M-BS cell interface. Open circles correspond to the values obtained from the M-M cell interface. Solid line and dashed line correspond to the regression lines generated using the plotted values from M-BS cell interface and M-M cell interface, respectively. Analysis using SPSS Statistics software with P value < 0.05 revealed M-BS cell interface and M-M cell interface regression lines to be statistically different in (A), (B), and (D) but not in (C). The plasmodesmata frequency per pitfield area was calculated using the linear equation, y = mx + b, where y is the plasmodesmata frequency, m is the slope, x is the pitfield area, and b is the intercept. R2 is coefficient of determination, where a value of 1 indicates that the regression line perfectly fits the data while a value of 0 indicates that the line does not fit the data at all.

