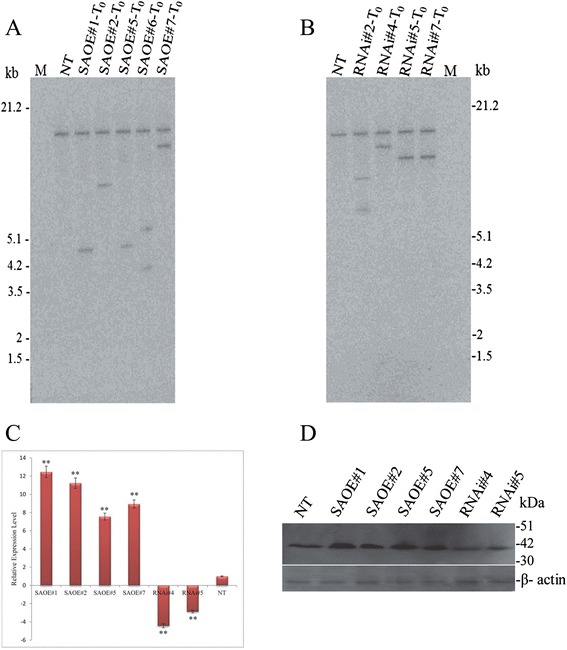
Fig. 4.

Molecular analyses of the transgenic rice lines developed for SAPK9 overexpression (OE) and RNAi-mediated endogenous gene silencing (RNAi). a Southern hybridization blot of T0 transformants of OE plants (designated as SAOE#1, 2, 5, 6 and 7). b Southern hybridization blot of T0 transformants of RNAi plants (designated as RNAi#2, 4, 5 and 7). For both (a) and (b), the HindIII-digested genomic DNA samples were used to probe with the 470 bp fragment of SAPK9 CDS. Lane NT- non-transgenic control, Lane M- molecular weight marker. c The relative expression level of SAPK9 gene was analysed in leaf tissues of OE, RNAi, and NT plants in vegetative stage through real-time PCR. For internal reference, the OsUbi1 gene was used. Error bars represent the mean ± SD of triplicate measurements. Student’s t-test was performed to find out statistically significant differences (**P < 0.01). d Western blot illustrating the expression level of SAPK9 protein (upper panel) in leaf tissues of OE, RNAi and NT plants, where β-actin protein (lower panel) showing equal loading in each lane
