
Fig. 3.
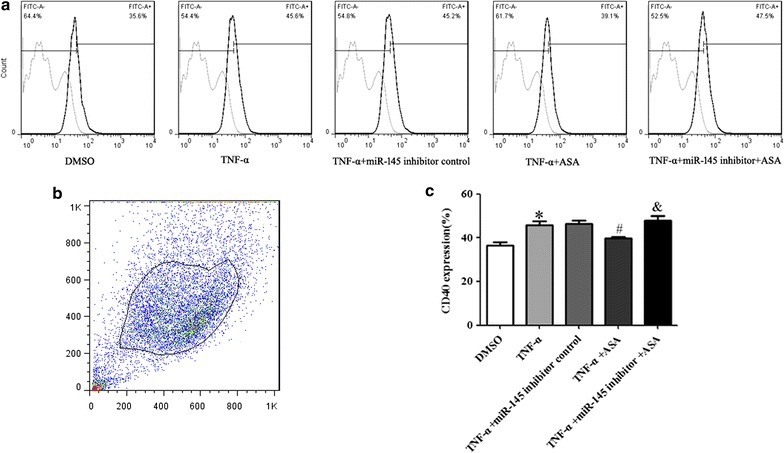
Evaluation of CD40 protein expression by flow cytometry inVSMCs. a CD40 expression on VSMCs with different treatment. b CD40 expression was determined by flow cytometry. c Statistical analyses of CD40 expression (%). Values are presented as mean ± SD; n = 3. Experiments were performed 3 times with similar results. *P < 0.05 vs DMSO, #P < 0.05 vs TNF-α, &P < 0.05 vs +ASA