Figure 4.

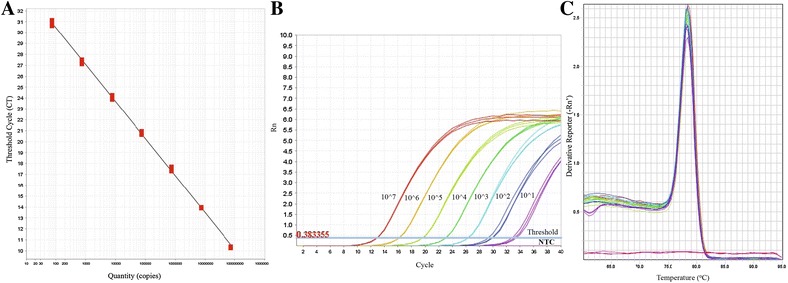
Standardization of SYBR green-based RT-qPCR for ORF 1a gene. A Standard curve, B amplification plot and C melt curve analysis over a linear dynamic range from 1 log10 to 7 log10 copies/reaction.

Standardization of SYBR green-based RT-qPCR for ORF 1a gene. A Standard curve, B amplification plot and C melt curve analysis over a linear dynamic range from 1 log10 to 7 log10 copies/reaction.