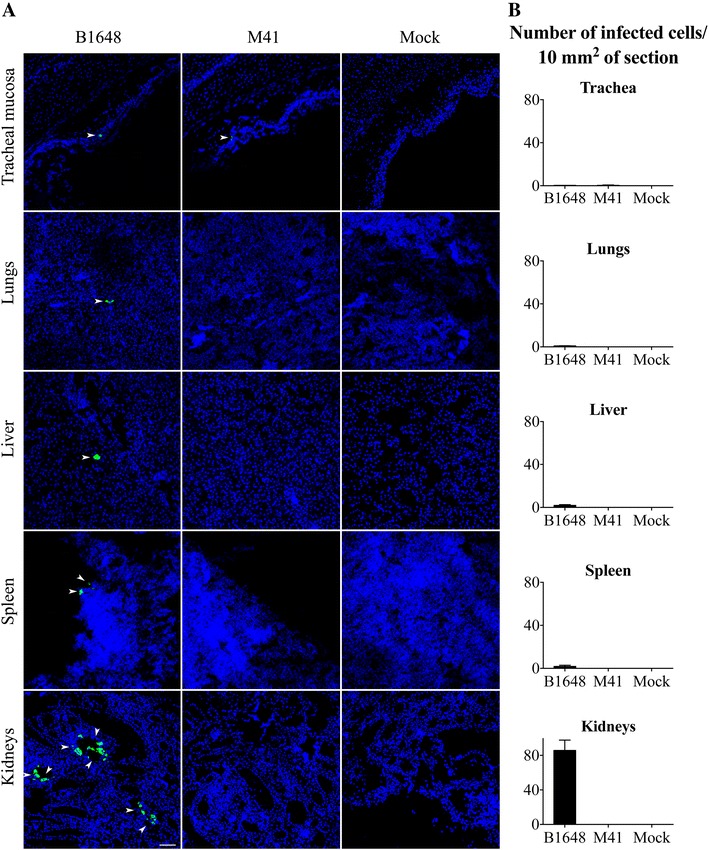
Figure 8.

IBV infected cell localization (A) and quantification (B) in various tissues at 12 dpi. Trachea, lungs, liver, spleen and kidneys were collected from IBV B1648 and M41, and PBS (mock) inoculated chickens at 12 dpi. A Representative confocal photomicrographs illustrating viral antigen positive cells (arrowheads). Green fluorescence visualises IBV antigens. Cell nuclei were stained with Hoechst (blue). Scale bar represents 50 μm. B Quantification of viral antigen positive cells was performed per 20 consecutive cryosections of 10 μm tissue. Viral antigen positive cells were quantified in the tracheal mucosa of B1648 and M41 infected animals and in the lungs, liver, spleen and kidneys of only B1648 infected animals. The average number of viral antigen positive cells present in different tissues is presented per 10 μm2. For each tissue, mean and standard deviation (SD) are shown.
