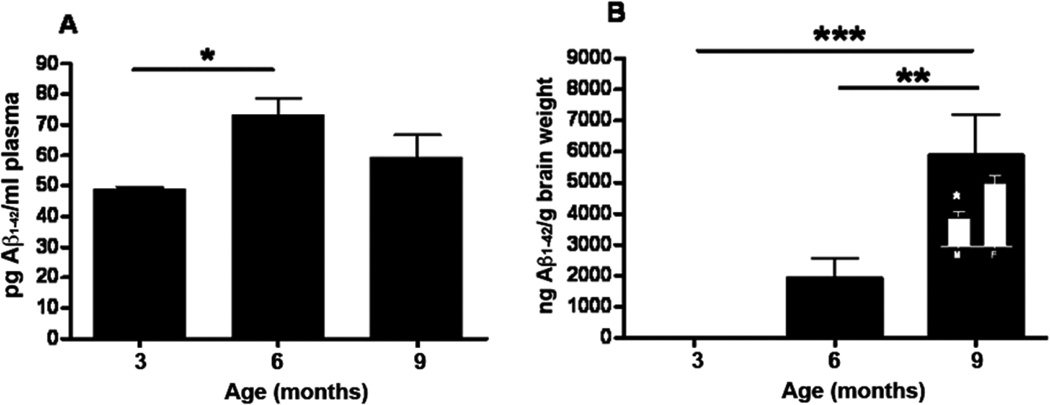
Figure 7. Plasma and brain Aβ1–42 levels in mThy1-hAβPP751 Tg mice with age by ELISA.

A) Plasma levels of soluble Aβ1–42 in the mThy1-hAβPP751 Tg mice at 3, 6, and 9 months of age. B) Insoluble hAβ1–42 in the FA fraction from the brain of mThy1-hAβPP751 Tg mice at 3, 6, and 9 months of age. Inset in the bar at 9 months indicates a gender-specific difference in FA- soluble hAβ1–42 at this age. Data are represented as means ± SEM * Indicates a significant difference with p<0.05 by one-way ANOVA. ** Indicates a significant difference with p<0.01 by one -way ANOVA. *** Indicates a significant difference with p<0.001 by one-way ANOVA.
