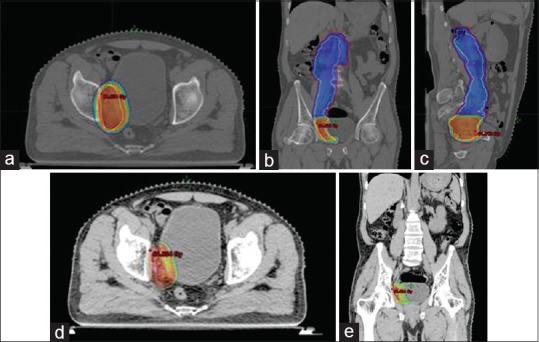
Figure 2.

(a) Axial view of the planning computed tomography scan showing dose distribution of 50.4 Gy target volume. (b) Coronal view of the planning computed tomography scan showing dose distribution of 50.4 Gy target volume. (c) Sagittal view of the planning computed tomography scan showing dose distribution of 50.4 Gy target volume. (d) Axial view showing dose distribution of boost area receiving a dose of 61.6 Gy. (e) Coronal view showing dose distribution of boost area receiving a dose of 61.6 Gy
