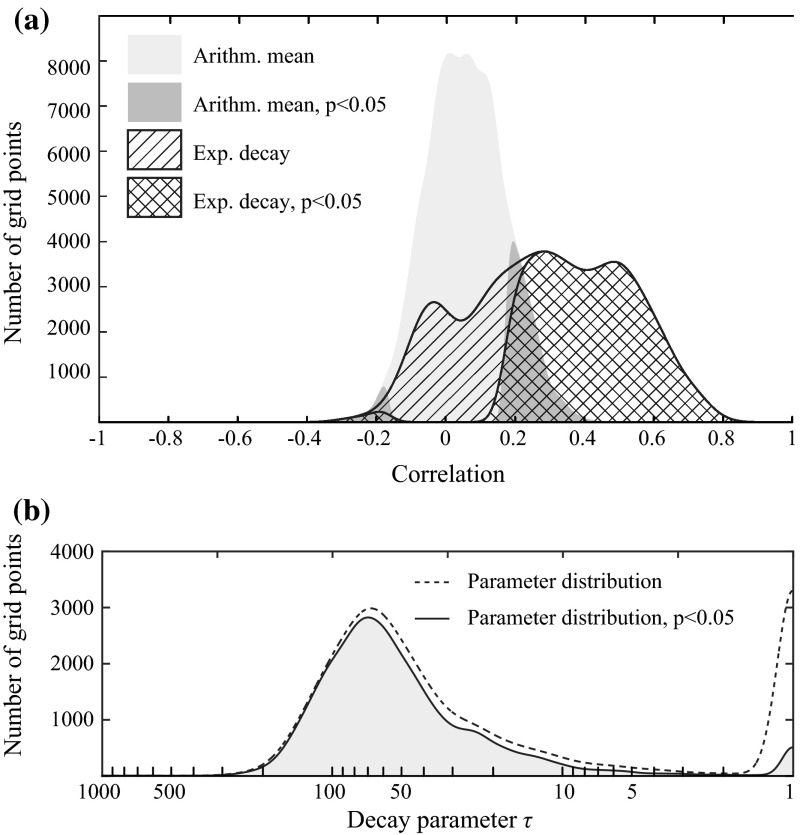
Fig. 12.
a Distribution of the correlation coefficients obtained with a simple average of the precipitation forcing (grey surface) versus the distribution of the correlation coefficients obtained with the newly introduced weighting function (hatched surface). The part of significant correlation coefficients (p < 0.05) is indicated using a darker colour or double hatching. b Distribution of the calibrated decay parameters used in the weighting function. Note the base 10 logarithmic scale of the x-axis

