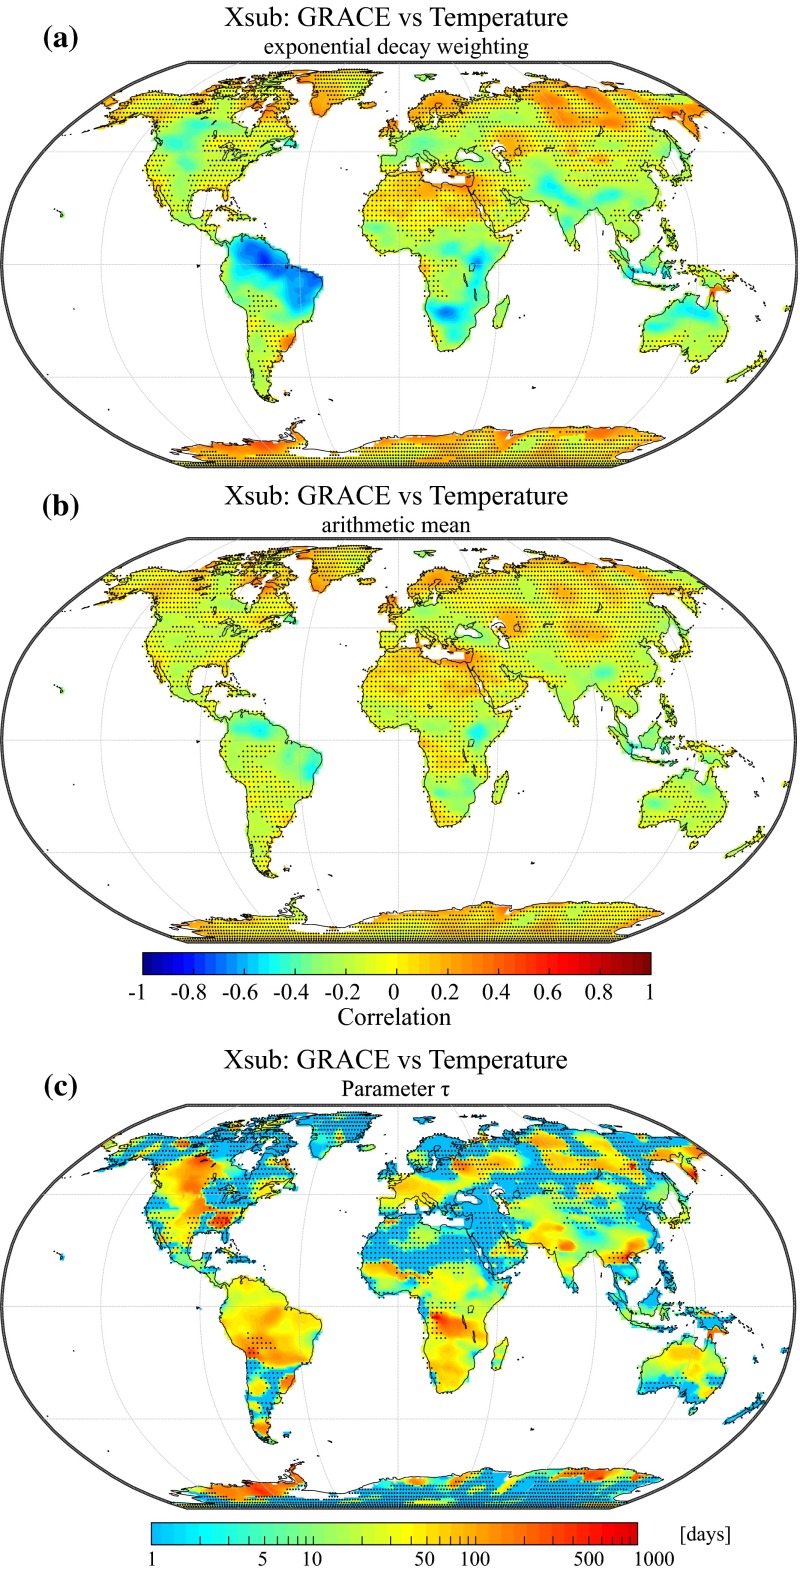
Fig. 13.
a Correlation between the subseasonal variability of water storage and temperature averaged with the weighting function introduced in Sect. 3.2 (Eq. 9). b Correlation between the subseasonal variability of water storage and temperature averaged using the arithmetic mean (Eq. 3). c Value of the calibrated decay parameter (τ) with units of days. Stippling indicates regions with non-significant correlation coefficients (p < 0.05)

