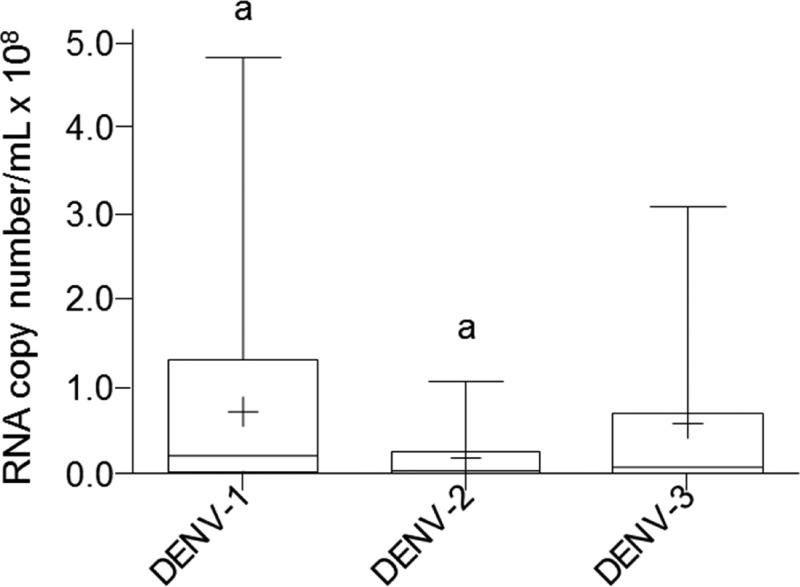
Figure 1.
One-step quantitative real-time polymerase chain reaction (qRT-PCR) analysis of Dengue virus load in sera grouped by viral serotype. The data are shown as box plots with the box extending from the 25th to the 75th percentiles, the line in the middle the median, and the + the mean. The whiskers represent the max/min values. Differences were considered significant at P < 0.05 using the two-tailed analysis of variance with corrections for multiple comparisons (Tukey) and were indicated by the same letters.

