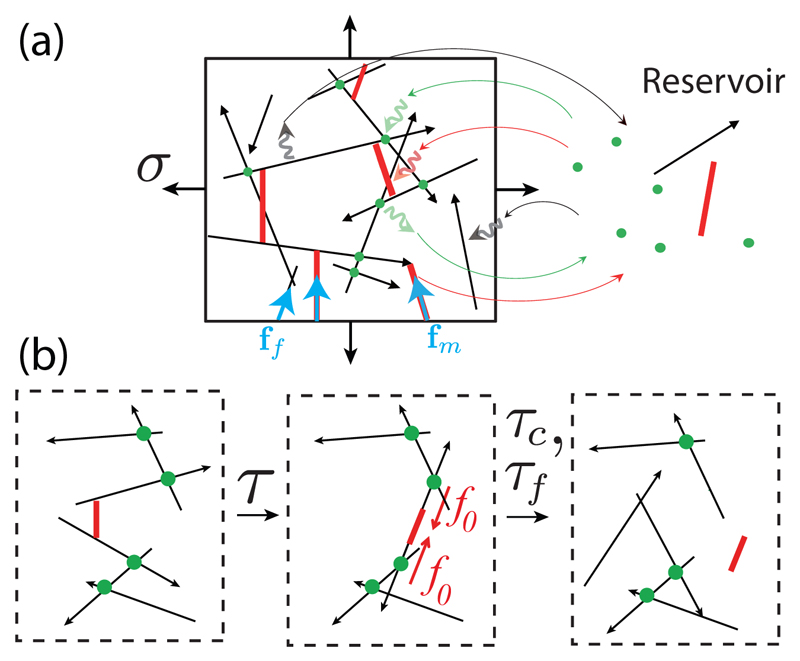
Fig. 1.
(a) Schematic illustration of a 2D cytoskeletal network (left). Filaments are represented by black arrows, motors by red bars, and cross-linkers by green dots. The network exerts a stress σ on the boundaries of the box, arising from tensions acting within the filaments (ff) and within the motors (fm). Motors move towards the arrowhead of filaments (for actin, the arrowhead corresponds to the barbed end). Network components stochastically exchange with a reservoir (right). (b) Motors move on filaments and rearrange the network on a time scale τ. Cross-linkers and actin filaments turn over on longer time scales τc > τ and τf > τ.

