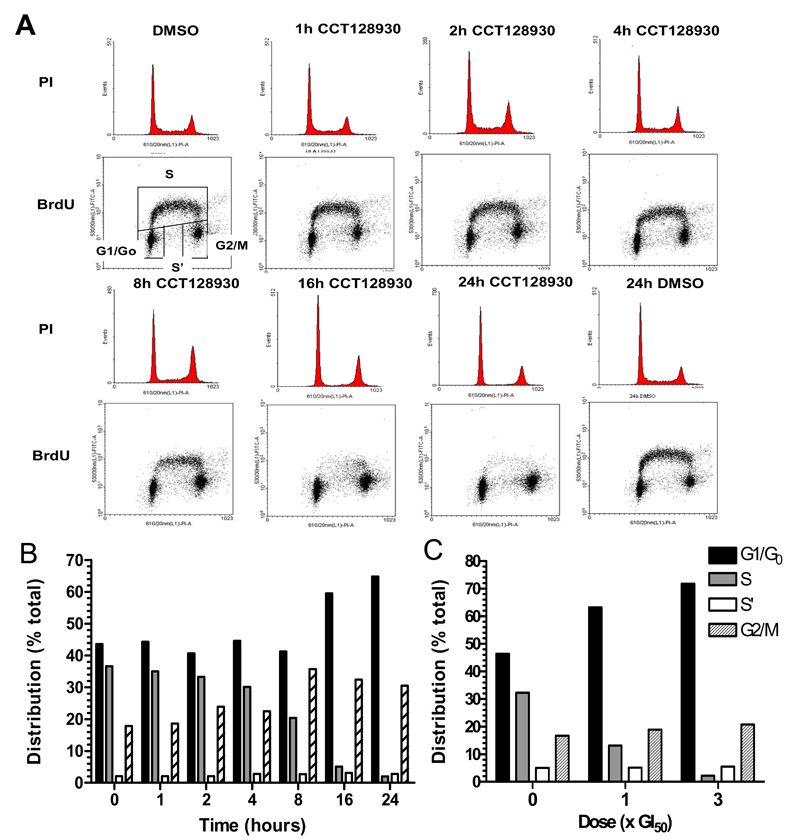
Figure 3. Cell cycle response of PTEN-null U87MG human glioblastoma cells to CCT128930.
A, Effect of a fixed concentration of CCT128930 (3 × GI50) on cell cycle distribution in PTEN-null U87MG human glioblastoma cells over a 24-hour time period. Histograms represent cell cycle distribution. Dot plots represent DNA synthesis in individual cells as measured by BrdUrd labeling and DNA content as measured by PI staining. Cell cycle distribution was quantified by BrdUrd analysis as described in Materials and Methods. B, Quantification of the effects described in A. C, Quantification of the effects of different concentrations of CCT128930 on cell cycle distribution of U87MG human glioblastoma cells at 24 hours. Similar results were obtained in a repeat experiment.

