
Figure 2.
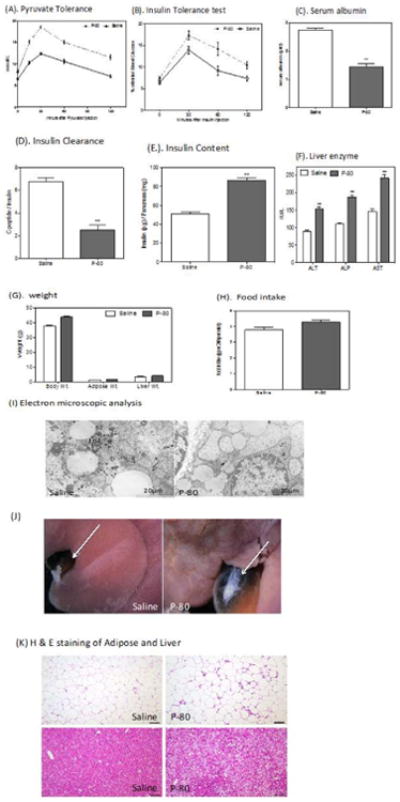
Metabolic parameter in P-80 fed mice.
P-80 promotes metabolic syndrome and liver dysfunction. Animals were injected intraperitoneally 2g/ kg body weight of pyruvate. Blood pyruvate was measured immediately before injection and 15, 30, 60 and 120 min after injection. (A) Pyruvate tolerance tests were performed after 4 weeks in P-80 fed mice and control littermates. Insulin tolerance tests were performed. (B) Insulin tolerance test after 4 weeks P-80 fed mice. Serum albumin levels were measured using an albumin determination kit. (C) Serum albumin level after 4 weeks in P-80 fed mice and control littermates. Liver enzyme was measured in the serum of P-80 fed mice. (D) Insulin clearance after 4 weeks P-80 fed mice and control littermates. Insulin content was measured in acid-ethanol extracts. (E) Insulin content after 4 week in P-80 fed mice and control littermates. (F) Liver enzyme after 4 week in P-80 fed mice and control littermates. (G) Body, liver and adipose weight (g) in P-80 fed mice and control littermates. (H) Food intake in P-80 fed mice and control littermates. (I) Electron microscopic analysis of liver section from P-80 fed and control littermates. P-80 fed mice shows giant mitochondria and moderate increase of lipid droplets (J) Gross appearance of P-fed and control mice liver. P-fed mice shows enlarge gallbladder. (K) Representative histology after H & E staining of adipose (upper panel) and liver (lower panel). Data are means ± s.e.m, n = 10. Significant was determined using one-way ANOVA corrected for multiple comparison with Sidak test. *P < 0.05 compare to ND treated group.