
Figure 2.
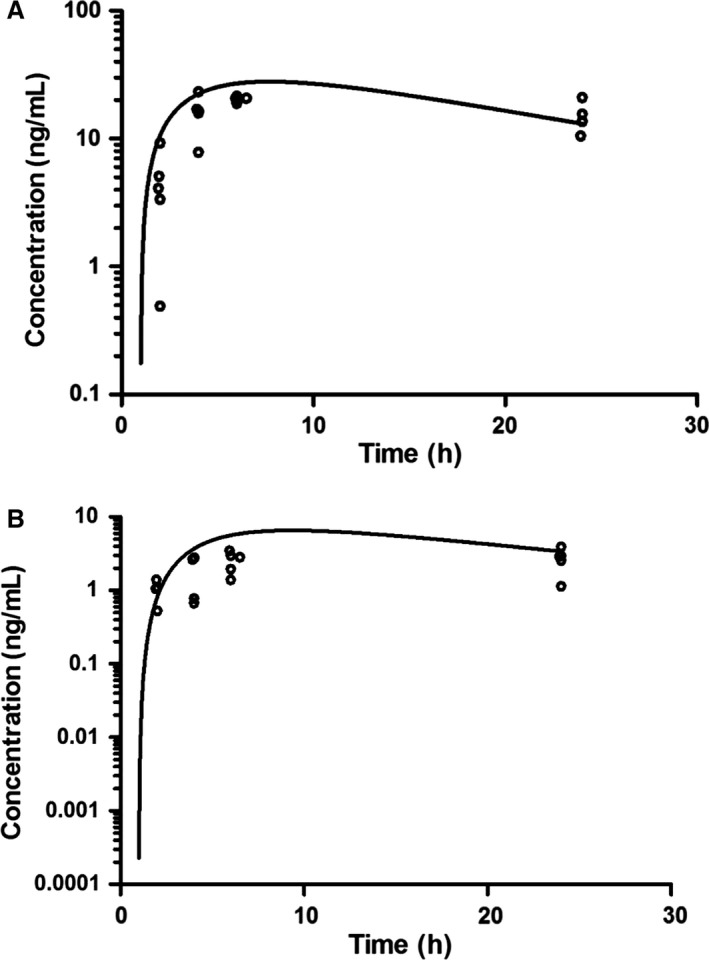
(A) Sunitinib plasma concentration‐time profile; (o) represents observed concentrations and best fit line from the average parameter estimates of five patients on Cycle 1 Day 1. (B) SU012662 plasma concentration‐time profile; (o) represents observed concentrations and the line represents the average parameter estimates of 5 patients on Cycle 1 Day 1.